The Australian Bureau of (Lies, Damned Lies and) Statistics
Australia's mortality statistics for 2022 are worse than the ABS is admitting to, so why are they tweaking the data - and where is the investigation?


By now it seems common knowledge that the pandemic year was not 2020 or 2021, but the post-vaccine rollout year of 2022. Nowhere is this more stark than in Australia, one of the few countries that has a relatively comprehensive COVID data set that can be interrogated.
So what happened? Well it seems, according to the Australian Bureau of Statistics latest release that there are a lot of people dying in 2022 that would not normally be dying based on every year previously. They even have pretty graphs to show the carnage….

You’ll note a couple of things hopefully from this chart. Firstly, that the overall mortality line is huge and well outside the previous years’ range. Secondly, there are a whole bunch of disclaimers below the chart of which (d) is the most interesting and is a political addition which we’ll come to. Finally, there is a blue line for “all deaths minus COVID deaths” which looks a bit closer but is a psychological trick to make you believe that the scary red line is all due to “COVID” and therefore some kind of accident that couldn’t have been avoided. This is far from the truth and will be discussed below.
The overall mortality is massively increased
Let’s get this out there straight away. It’s a huge increase. I have posted previously my preferred way of representing the unbelievable excess in deaths following the vaccine rollout and this is the update, taking away their ridiculous blue line.

It’s worth noting that I pointed out the excess deaths in Australia in August, as did others.
At that time the excess deaths were 15,000. That is, 15,000 people more people died than should have been expected based on the previous years’ deaths. The updated number now is about 21,000.
To put this into perspective that is the equivalent of about 100 fully loaded Qantas 737-800 crashing in one year.
Worse - 30 of those crashes happened after we raised the alarm on the first 70 crashes.

There were over 25,000 reads of that short article and not one media or government representative attempted to make contact to discuss it. I guarantee that they know that it was being discussed. Instead of enacting an urgent investigation, their response instead was to try to make the data look better and find some excuse.
Another way of representing the data is our favourite multiple-of-sigma (multiple of the standard deviation). In the revised calculations I present below the overall deaths in 2022 (up to week 34) represents a nine sigma increase. This is what that looks like

Sticks out like a sore thumb doesn’t it? Just so you can put things into perspective, this is a nice little chart on wikipedia that shows you how often you might see such a “black swan event” by chance. It stops at 7-sigma. We’re talking about a 9-sigma event.
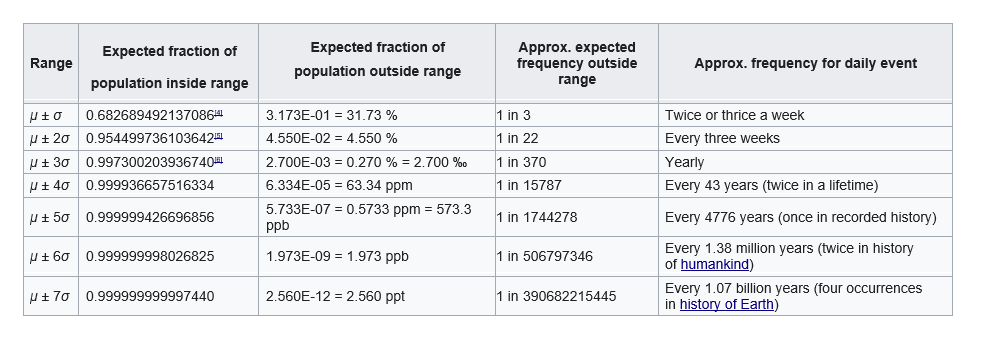
[EDIT: It’s worth adding that there was a small population increase since 2015 from 24m to 25.8m. Adjusting for the population makes no real difference to the significance of the increase in deaths (8.7 vs 9 sigma)]
The dodgy baseline
Until this point the ABS did nothing wrong in publishing the data. Admittedly they are not being completely transparent (because no government department ever is) but they have provided provisional statistics in advance of many other countries. But what they have done is invent this dodgy baseline that is new. So let’s look at the impact of what they did.
Here is the mortality data by week1

You should hopefully notice that the green lines (pre-2020) are pretty close and the yellow 2020 line is overall lower apart from a blip in April which wasn’t actually related to COVID deaths, which mostly affected Victoria in July . The monthly report looks something like this extended over the year

So you should be able to see that the 2020 year is relatively typical. In fact we can do a statistical test on this and show that the average number of monthly deaths in 2020 was 13,549 vs 13, 553 for all other years 2015-2021 (p=0.98) showing that it was almost exactly the average year for deaths in recent times2.
So why did the ABS decide to remove it from their baseline calculation? This is their explanation:
“Baseline average is the average of the years 2017, 2018, 2019 and 2021. 2020 has been excluded as it did not resemble a typical mortality year. Refer to the methodology for further discussion on baseline year selection.”
So, do you think it represents a typical mortality year given that it was exactly the average of the surrounding years, or is this the ABS unnecessarily adjusting the statistics to fit a narrative?
What is the effect of the change? A quite significant increase in the baseline, i.e. an effect that makes the “new normal” mortality look a little bit less scary

Isn’t it amazing that every time a government agency or a media “fact check” gets it wrong, it always conveniently seems to benefit either the government or the corporations working directly with the government. The really annoying thing is that this has happened before and we keep ignoring it.

Yes, that Associated Press. The one that claims to be the arbiter of truth. I mean, the whole idea of the AP collaborating with governments to help impose a fascistic regime using propaganda - that’s totally ridiculous [even though they actually did it 75 years ago]

So, what happens when you inflate the baseline and then decide to remove “COVID deaths” from the overall death numbers? Well, it doesn’t look too bad at all (😬).

“See, look, once you take COVID out of the equation the death curves just about overlap with the historical range!”.
I mean, it’s absolutely ridiculous. Not only are they misrepresenting the data by manipulating the baseline but they doing this to try to show that - after they forced vaccines on every single member of the public that they claimed would stop the pandemic™ and then made it worse - it wasn’t that bad. Well it is, because the overall mortality rate is now 21% above baseline and that is a lot of dead people.
There was another cheat with the “blue line” too. Subtracting “COVID deaths” is not appropriate as a unilateral intervention, because prior to 2020 “COVID” deaths were pretty much “Influenza and pneumonia” deaths as the same people were at risk (elderly, infirm, people with comorbidities etc). You can’t then just subtract COVID deaths from 2020+ and not subtract “respiratory infections” from the baseline. That’s cheating. This is discussed further in the next section
Where did the ABS hide the bodies?
A very important aspect of the ABS report is the way that the categorised deaths were reported. Because there is an increasing number of deaths from myocarditis and heart disease reported around the world it is vitally important for those that believe the mRNA vaccines are “safe and effective” to ensure that the data don’t show this. If you read the report you’ll see in fact that there is hardly any increase in deaths from cardiovascular disease. Even more crazily, cancers, strokes (CV disease) and pneumonia are down! Can you believe it? Aren’t our government doing a great job - look:
So let’s look beyond the propaganda (and yes, the cancers are up, it was just the presentation that made it seem otherwise) at the actual data. A point of note is that the reports contain figures for “Total deaths” and for “Doctor certified deaths”. Although it’s possible to hide extra deaths in this differential the doctor certified deaths are quite consistently around 88% of the overall deaths, so that hasn’t changed since 2015. For 2022 it’s 88.2%

Here is the categorised data collated from the downloaded reports for 2015-2022. For week 1-34 the totals for doctor certified deaths is 111,391 and the total for all deaths is 126,289 (giving 88.2%).

These figures are for doctor-certified deaths and it is quite clear where the bodies are buried. The biggest category is “Respiratory incl COVID” for which I have combined respiratory and pneumonia deaths with COVID because, well, they should be in the same category.
There are nearly 8000 excess deaths in this category alone and make up the majority of the excess deaths. So why are there so many?
The COVID catastrophe
Well, part of the reason is the treatment protocols for those with “viral pneumonia” which was not that common as a cause of death. In fact, it is quite common to get a cold and then get a chest infection (aka pneumonia) and prior to 2020 this would have been quite happily treated by your GP with antibiotics before you got ill enough to need to go to hospital. Not now. Now, because of the “evidence based treatment protocols” from covid19evidence.net.au (which have no named author - so who wrote them?), if you get a pneumonia after a positive test for “COVID-19” this is what you are told:
go home
don’t come back until you can’t breathe
don’t take antibiotics of any sort
don’t take any other repurposed and safe drug
only take molnupiravir or paxlovid - which not only don’t work but can make things worse and are experimental
if you do come back we will give you remdesivir even though we know it doesn’t work and causes renal failure
if you can’t maintain your oxygen saturation we will put you on a ventilator rather than treat you with antibiotics
Guess what happens if you follow that protocol, particularly if you’re frail? Your risk of death goes through the roof. And if you don’t believe me that these are the protocols here you are:

And this is not even a new thing. It has been going on since April 2020 when we all knew that the hydroxychloroquine + azithromycin combination had effect in the early treatment of “COVID” which is why there were over 500 papers written about that combination alone in 2020. Azithromycin was already widely used by doctors but you can see how much the impact of this combination had on the prescribing practices in Australia because the TGA blocked the prescribing of hydroxychloroquine “due to supply issues” even though Clive Palmer imported 30 million doses.
Just to push the point home (that mortality due to COVID was - and is - probably entirely due to the withholding of early treatment for pneumonia) if you have time please take a look over at our friend Daoyu’s blog that outlines what happened to the very first case of COVID in the US who had white-out lungs from “COVID” but miraculously was cured within 2 days of antibiotic therapy.

I can’t stress this enough so I’m going to put it in a box:
If it is ever confirmed that the entirety of deaths from COVID-19 were due to the withholding of antibiotic therapy in early pneumonia, which was standard practice prior to 2020, the authors of covid19evidence.net.au (and similar protocols worldwide that implemented the DO NOT TREAT dogma) cannot be criminally investigated because they do not exist.

Doctors who withheld valid treatments on the basis of an anonymously authored protocol must take on the responsibility for doing so, and have no immunity from their governments.
I would go further into this but this article is already too long. If you are interested you should definitely listen to JJ Couey who talked about exactly this on his gigaohmbiological stream recently. All I can say is - prepare to be confronted.

The New Dementia Epidemic
Of the other categories of death “dementia” has increased by 27% accounting for an extra 2453 (12 Qantas planes) of additional deaths. I am happy to blame this on government policy because the government decided that not only must aged care workers take 3 doses of the experimental RNA therapy (egged on by 2GB’s hotshot Ben Fordham who masqueraded as a champion against mandates whilst promoting them for healthcare workers) leading to an exodus from the field, but the residents of aged care themselves were basically shut out from the world for months on end due to ridiculous COVID policies and legislation. So the old people were being neglected to death but it was OK because the death certificate could just be signed as “dementia” and nobody will notice. Until we did notice.
As a reminder, Harold Shipman the famous UK doctor who put 250 people “out of their misery” (aka murdered them with heroine and midazolam) pales into insignificance when compared to the 2453 extra dementia deaths from the combined policies of the state and federal Chief Health Officers of Australia.

The Coming Cancer Wave?
In the figures provided there is a highly significant increase of nearly 10% in cancer deaths in 2022 compared to prior years. This absolutely cannot be explained by the COVID excuse so what is happening?
Well, it could be that more people are dying of cancer - even if there is no increase in cancer rates - because of the fact that people have stayed away from hospitals (due to the fear of COVID propagated by the media and health authorities). If that is the case, those deaths (2659 of them so far this year, that is - 13 Qantas airliners) are down to the media who facilitated the government in scaring the country into staying at home.
A more insidious explanation we have discussed before and it relates to the possibility that the vaccines themselves are increasing the risk of cancer mortality. We don’t have time to go into this in today’s article but if you have time you’ll find this in “Welcome to Gilead”
In fact, we know that the COVID vaccines are causing cases of cancer to occur or recur - with a large batch of reports on pubmed already on haematological malignancies post-COVID vaccination. The most dramatic of these was a self publication by Professor Michael Goldman whose story was also reported in the Atlantic magazine. You can see the outcome of his lymphoma in this dramatic PET scan picture (the black blobs other than brain, heart and bladder are the lymphoma).


The point being again that a 10% rise in cancer deaths is a huge safety signal. The ABS and the government either don’t care or would rather we don’t talk about all these deaths because we will have to blame someone. And that someone is the person who decided we should take this path out of a “pandemic” that might never have been a pandemic at all without manipulation and propaganda.
Where are all the heart attacks?
One reassuring bit of news from this analysis seems to be that there hasn’t been a huge increase in cardiac deaths - or has there?
You see, the biggest increase in absolute numbers has been in the “uncategorised” category, which has increased by a whopping 5591 deaths (or 28 Qantas planes). There is no good reason why “uncategorised” deaths should be up. And this is not even including the 14,898 uncertified deaths of which we can estimate there are another 4000 in the “uncategorised” category.
This rise of 23% in this (un)category of deaths is hugely significant both in statistical terms but also in absolute numbers with over 6000 excess deaths in this category alone.
There is no excuse for underplaying this huge death toll which smacks of intentional malfeasance.
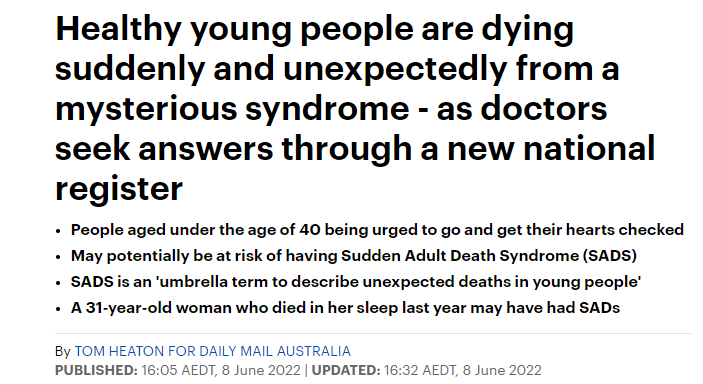
Irrespective of the cause we know that the vaccine rollouts themselves were associated with spikes in all-cause mortality. Since then there have been multiple news reports of vaccinated athletes dropping dead on the sportsfield in unprecedented numbers and young people dying suddenly including 80 doctors in Canada. It’s such a large elephant in the room we now even have a new term for it - “Sudden Adult Death Syndrome” . You literally can’t make this up. This has never been a thing before 2020, when a healthy 30-year old dying in their sleep just didn’t happen.
So what could be happening? Well, if we would be allowed to talk about it we might be able to stop deaths happening. For that to happen we would need an open conversation in an environment where doctors and scientists don’t have to hide behind avatars on anonymous blogs. In such a situation we could actually have a free and open discussion about not only if the mRNA vaccines are responsible for the huge spike in deaths but why they are. In fact, we’re already doing this but you wouldn’t know because we have to conduct this kind of research in clandestine telegram groups [yes, that is actually what is happening to doctors and scientists in 2022].
Anyway, here’s the theory. Explained in detail by my friend “Doorless Carp” in his article “MicroRNA miR-21, Cancer and Circadian Rhythm Related Cardiovascular Accidents”. I would certainly encourage you to read it but my take on it is this:
Theory: The mRNA vaccines appear to provide an ongoing and persistent assault on the myocardium via multiple routes. These include autoimmune disease, direct toxicity from spike protein and microRNA-mediated pathways. This culminates in the combination of myocarditis, cardiomyopathy and/or arrhythmia. The final insult occurs at the time of circadian stress due to the early morning catecholamine surge and results in acute ventricular arrhythmia leading to a sudden non-infarct death. Bear in mind that this only addresses the possible cardiac deaths but there are a whole host of other mechanisms, such as T-cell exhaustion, by which the COVID vaccines could impact on life-dependent pathways that we haven’t even touched on.

Because this huge cohort of deaths is uncategorised, it is impossible to know whether they are being put into this category in order to dilute another category, or if there is some other common cause to the deaths. There is no way to know this because the ABS has control of this data.
Where are all the bodies buried?
The point of this article is to highlight the sheer numbers of unnecessary deaths that are happening on an unprecedented scale in Australia in 2022. The majority of those are “uncategorised” but the scale of failure to prevent respiratory deaths - most of which should have been prevented - is massive.
There are a whole host of reasons that this disaster could have happened that have been outlined above but the takeaway message is this:
Why is the ABS and every other government department seemingly hell-bent on covering up thousands of deaths by failing to investigate them, quashing freedom of information requests and hiding behind a wall of secrecy?
And I have a message for all the government departments and their bureaucrats that think they are above us:
It is not your data, it’s ours. You have no right to hide it. You have no right to create policies that destroy lives without authorship or accountability. You have no right to deny freedom of information requests and you have no right to manipulate data to hide deaths on an unprecedented scale.
Eventually, the truth will always find its way out.

The “normality” of the 2020 mortality statistics remains even when the data is adjusted for population.

I would make the observation that Trevor Sutton - brother of the Victorian Chief Health Officer is deputy Australian Statistician. Most people would consider that a conflict of interest but apparently not in the Australian Govt.
The ABS is worse than you imagine. They changed the baseline for calculating excess deaths from 2015-2019 which is defensible to 2017-2019, 2021 an error that a high school student could point out. 2020 was dropped for some BS reason. The effect of just this change is that the excess deaths are depressed about 3-4% compared to using 2015-2019.
Using the ABS numbers of deaths and different baselines for 2002 deaths to the end of August:
ABS baseline - 17% excess
2015-2019 baseline - 19.8% excess
2010=2019 baseline - 24.5%
I live in Brisbane and the ambulances have stopped using lights and sirens for emergency callouts - there were so many that even the sheeple were starting to notice.
I heard a grief specialist say that this is equivalent to 5 x the number of people who died in the Twin Towers tragedy. She spoke about the massive outpouring of societal grief over that event and pointed out that Australia will be experiencing a huge swell of grief this year and over the next few over this... even if people don’t know the how and why of it, but just that many untimely deaths. The effects of this will be monumental.