

The curious case of the miscalculated miscarriages
Unpicking the v-safe pregnancy registry publications

What is the rate of miscarriage in pregnant women receiving a vaccine (more accurately a gene therapy vaccine or GTV) against COVID-19, and is it any higher than for women not receiving a vaccine?
TLDR: It’s high and it’s impossible to get the information from the published papers without a delve into the data. So read on…
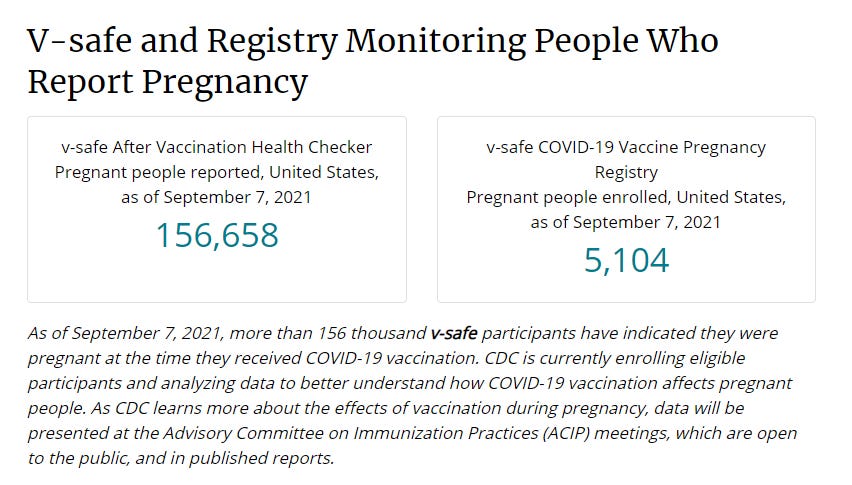
What a great question! You would think it would be such an easy question to answer given that 150,000+ women have registered on the CDC’s “V-safe” pregnancy registry (a taxpayer funded registry to monitor the effects on pregnancy for those that have actually received the GTV during or just prior to pregnancy). As of the 12th Sept there were 156,658 women registered but only 5,104 women registered for the study - about 3%. Curious, eh? You would think that women motivated enough to sign up for the registry during pregnancy would also sign up for the monitoring study.
Anyway, we are left with this tiny sample of 5000+ but when it comes to actually publishing any data we actually end up with less than half that. There are two studies published:
(i) “Preliminary Findings of mRNA Covid-19 Vaccine Safety in Pregnant Persons” published in the previously prestigious New England Journal of Medicine (until Lancetgate, but that’s a story for another day) here:
https://www.nejm.org/doi/full/10.1056/NEJMoa2104983 and
(ii) “Receipt of mRNA COVID-19 vaccines preconception and during pregnancy and risk of self-reported spontaneous abortions, CDC v-safe COVID-19 Vaccine Pregnancy Registry 2020-21” published only as a pre-print on Researchquare here:
https://www.researchsquare.com/article/rs-798175/v1
Here is the difference between the two papers (v-safe 1 and v-safe 2)

You can see immediately that the two papers are not comparable, despite being intended as an update from one early version to a later version. In v-safe-1 “Completed pregnancy” means any pregnancy that has resulted in a miscarriage (ended before 20 weeks) or a delivery after 20 weeks (usually that means a live birth but includes stillbirths).
In v-safe-1 the were two main themes of the study i.e. the miscarriage rate and the risk of abnormalities in the babies which were delivered. I am only going to focus on the miscarriages.
In this study the following statement was made in the abstract:
“Among 3958 participants enrolled in the v-safe pregnancy registry, 827 had a completed pregnancy, of which 115 (13.9%) were pregnancy losses and 712 (86.1%) were live births (mostly among participants vaccinated in the third trimester).”
So you’d think that this means, barring the 1 still birth (within normal limits rate-wise) the miscarriage rate was around 13.9%? Right? Wrong.
Miscarriage rates can be reported in either of two ways - either a “per week” rate or an overall rate. Why? Because the risk of a miscarriage drops significantly from week 6 (two weeks after a missed period) to the second trimester (week 13-14 onwards). Before 6 weeks the miscarriage rate is high (estimated at up to 25%) and completely unknown, because most women who miscarry at that early stage either don’t know, don’t attend for care or are not registered as a pregnancy so can’t be tracked. For women who have a proof of viability at 6 weeks or greater the risk of miscarriage is much lower and drops every week.
This is shown very clearly in a paper from Australia in 2008, published by the ex-president of RANZCOG. Women were followed up from the moment of confirming pregnancy between 6-12 weeks. The overall risk of miscarriage of the group (696 women) was 1.6% (11 miscarriages in 696 pregnancies) but the weekly risk of miscarriage drops from 9.5% at 6 weeks to 0% at 11 weeks.

This is replicated in all studies of miscarriage but highlights a really important confounder - confirmation of pregnancy at 6 weeks or more reduces the overall risk of miscarriage to single digit percentages. In fact there are older studies like this but these included women followed up before the advent of routine dating ultrasound (around 2005 onwards) and the result is that studies produced after 2010 have generally lower miscarriage rates than those pre-2000 (because of the selection bias of reporting on confirmed viable pregnancies only, as well as possibly some nutritional improvements over time).
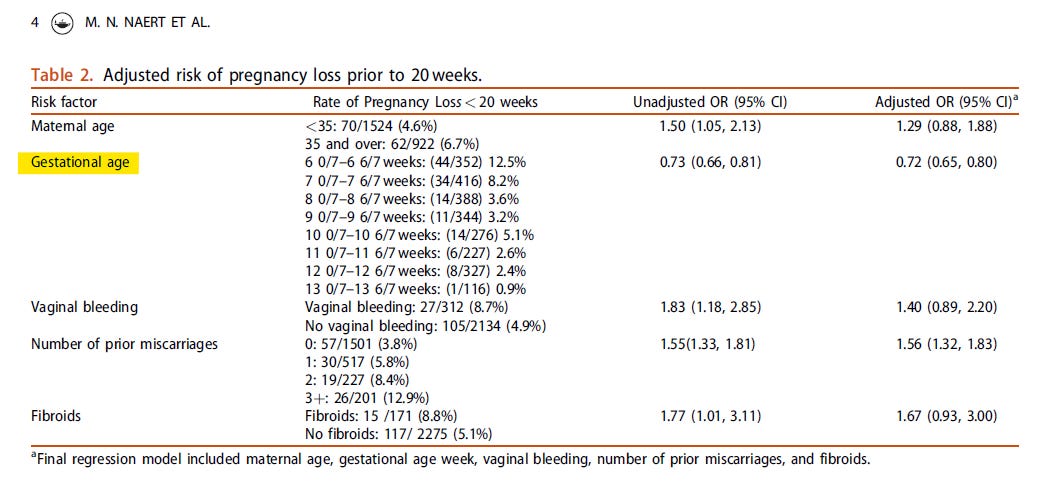
The most extensive and comprehensive study of this sort (2500 women) was only just published in November 2020 so can be relied on to represent contemporary data and is here (Naert et al which I should call the population-miscarriage-rate-study), showing the miscarriage rate at 6 weeks of 12.5% dropping to 0.9% at 13 weeks and an overall rate of 5.4%
In v-safe-1 the miscarriage rate was not given by week but in fact was given as an overall number, 104 miscarriages. They then quoted this (plus 1 stillbirth and 10 terminations/ectopic pregnancies) i.e. 115 as a numerator of 827 total “completed” pregnancies (i.e. miscarriages and full term pregnancies) giving a “fetal loss” rate of 13.9%.
Whilst this might be true (because that was the proportion of losses of “completed” pregnancies) it is a disingenuous figure and one which would never be used in practice. Firstly, one would not use a denominator of “completed pregnancies” at a short time point that did not include the whole term of the pregnancy. Secondly, one would not include terminations (colloquially called “abortions”) in numbers for “fetal loss”.
So, here’s the rub. There were actually 1132 first trimester (before 14 weeks gestation) vaccinations in this cohort. Of the 104 miscarriages, 96 occurred in the first trimester and 8 in the second trimester. Assuming these 8 related to vaccination in the first trimester the actual first trimester fetal loss rate was 104/1132 or 9.2%.
In fact, as we will see, this is closer to the 5-6% population rate seen in Naert at al. and begs the question “why did v-safe report a much higher fetal loss rate than was actually the case?”. We’ll come back to that but it is noteworthy that despite reporting a 13.9% fetal loss rate the authors declared this rate to be within normal limits and “Preliminary findings did not show obvious safety signals among pregnant persons who received mRNA Covid-19 vaccines”.
I should note at this point that the paper was so confusing, with no logical sense of how the 13.9% figure was calculated, that some groups took to social media to declare that the “actual rate of miscarriage was 82%”. This was truly a misunderstanding of the numbers in table 4 of the paper, which I can only assume was deliberately confusing.

In this interpretation the idea was that there were 827 completed pregnancies but 700 women received their dose in the third trimester therefore the denominator should be 827-700, which is 127. Therefore 104/127 = 82%. But this completely ignored the rest of the 1132 women who were registered in the first trimester as having received a vaccine and continued with their pregnancy. These of course would not registered in the “completed pregnancies” because it takes 6 months to go from the first trimester to delivery (mostly). The only pregnancies that started in the first trimester and “completed” by the time of the study (3 months later) would of course be miscarriages and if it wasn’t for the confounders of terminations, ectopics and stillbirths this figure should be 100%! [127 less 10 termination/ectopic; less 1 stillbirth; less 12 twins = 104]
So, now that’s out of the way let’s get back to the correct interpretation of the data. The first paper in v-safe-1 was clearly somewhat premature because although there were some third trimester registrants the majority were first or second trimester and wouldn’t have been due to delivery full term. So in comes the second paper in which a fuller assessment up to 20 weeks is made, we’ll call this v-safe-2 and a reminder it is a pre-print here.
In v-safe-2 the authorship drops from 21 authors to 13 with the lead author now Lauren Zauche who despite being not extensively published and having received some interesting feedback on this paper on researchsquare has managed to secure her pre-print to full peer reviewed acceptance to the (you guessed it) New England Journal in record time. I will speculate that the final publication will be little different from the pre-print.

So in this study we now have some more time and a good cohort who have got through to 20 weeks. In fact the paper helps us greatly as it breaks down the pregnancies and miscarriages (termed SAB or spontaneous abortions) at each gestational week. It’s quite a complicated table and the description of the methods in the paper is, again, somewhat confusing but we can break it down. I’ll come to the actual table in a minute but the first thing to look at is the CONSORT diagram which tells us how they get to the figure of included participants.

Two things stand out here. There are 2456 participants but before these are included 35 have already been excluded due to their miscarriage before 6 weeks gestation (odd, because they should be pregnant before they get their vaccine otherwise wouldn’t be likely to sign up to the registry). Then another 253 participants are simply excluded because they were “last contacted” before 20 weeks, with no explanation as to what happened to them (but could reasonably be assumed to have miscarried). If we exclude these 288 women for now we get to see what the miscarriage rates are in table 1 and the authors declare “Among 2,456 pregnant persons who received an mRNA COVID-19 vaccine preconception or prior to 20 weeks’ gestation, the cumulative risk of SAB from 6–19 weeks’ gestation was 14.1% (95% CI: 12.1, 16.1%)”.
It is of significant interest that the “miscarriage rate” here is very similar to the 13.9% “fetal loss” rate in v-safe-1. Except we now know that that rate was incorrect and the actual overall (or cumulative, because we don’t know the numbers by week) miscarriage rate was 9.2%. So has the rate jumped from 9.2% to 14.1% in the additional 2 months of data collection, or is the 14.1% figure also wrong?
Here’s table 2 which gives the number of miscarriages by week. I have not published table 1 because it’s very busy and not that helpful.

You will notice that the week-specific miscarriage (SAB) rate drops from 8 weeks, as you’d expect. In keeping with this group’s presentation the table is quite confusing even though it looks simple. The “number at risk” is the cumulative number of participants for each week, starting at 904 then add x new recruits (at the next gestational age) less y miscarriages (as those women can only be counted once and have ended their pregnancy). The “week specific SAB risk” is therefore the week’s miscarriages divided by the “number at risk” at that gestational age. As you’d expect it drops with gestational age.
There are two big problems with this table though.
(1) The “cumulative SAB risk” is an odd calculation and I’m not really sure why they have used it. At each week they appear to add the week’s miscarriages as a proportion of the cumulative total of participants to the previous week’s “cumulative % risk”. This is not the same as just taking the cumulative miscarriages as a proportion of the cumulative participants entered into the study, which most people would accept as the correct rate. In fact it is a censored (filtered or adjusted-by event) rate. It comes about by using both a reduced denominator (the miscarriages for each week divided by total number of women less those that have miscarried) and by using an arithmetic calculation (addition) of percentages from a changing denominator. If you’re not confused by this, you probably should be.
(2) The behaviour at 6 weeks and 7 weeks defies all known papers published on miscarriage rates by gestational age because the week 6 and week 7 rates are far lower than week 8 and week 9. This just would not happen. There is missing data here. In fact, to be in any way comparable to the Naert et al (population estimate) data set you would need a miscarriage rate (weekly) of around 12% - say 10% as a low estimate. For the 900 women that “suddenly” joined the study at the 6 weeks point you would expect 90-100 miscarriages in that week alone. That assumes we are still excluding the 35 miscarriages conveniently left out as being “before 6 weeks”. This therefore suggests that, of the 253 participants with “lost contact”, at least all 65 referenced in the paper as having last contact before 13 weeks had miscarried and almost certainly many of the remaining 188.
So, what does a comparison of v-safe-2 and the (Naert et al) population data really look like? Well I’ve done it for you, here:
In this graph the grey line is the Naert data and the orange line is the unadjusted v-safe-2 data showing a miscarriage rate hovering around 10-11%. Error bars are included based on the method in the v-safe-2 paper.
The red line shows the v-safe data assuming that the first cohort of respondents (at week 6) has a miscarriage rate of 10% (by adding the missing 75 patients), and results in an overall miscarriage rate of about 15% - three times the population (Naert et al) rate.

You can still see that there is something wrong with the data because the miscarriage rate rises before it falls. This is a result of the unusual distribution of miscarriages by week in this data set, with a rise at 8-9 weeks. Really that just shows that there is something wrong with either the data (overly censored with bias against including early gestation women) or the way the gestation of miscarriage has been recorded.
Either way, it’s not good and the authors should have released the raw data for verification when there is such a glaring inconsistency with what one would expect with a data set of this type.
Interestingly, the actual cumulative rate of miscarriage by 13 weeks in v-safe-2 is only 10% (154 miscarriages for a cumulative denominator of 1543 pregnancies) (see the orange line at 13 weeks on the chart above) yet was reported by the authors as 14%. The 14% was calculated in a very odd way (by arithmetically adding the percentage rate of miscarriage at each week, despite a changing denominator by week). However, the 14% figure conveniently matches the v-safe-1 13.9% figure which also conveniently was dismissed by the authors as “similar to… published incidences in pregnant populations”. Yet the “published incidences” referenced were historical rates that included pregnancies before 6 weeks, which were not included in this analysis. In fact, the v-safe cohort was a relatively healthy cohort with a lower risk of prior miscarriage than the Naert et al cohort and therefore should have had a lower risk of miscarriage, not a far higher risk.
The bottom line is that the data have been presented in a very confusing way, obfuscating any possible analysis by most readers.
That was either by design or an accident but in the absence of a control group to corroborate, the risk of miscarriage in the v-safe pregnancy cohort is very high. The data needs to be released so that those who are able to properly analyse it can do so - without the conflicts of interest that can arise when publishing data from the same institution that has gone all out to advise uptake of this therapy in pregnancy without any long term (or even, it seems, reliable short term) safety data.
Great analysis. Please get in touch!
Great analysis, I really really wonder why the v-safe data is guarded and inaccessible. Would a FOIA request for access to anonamised v-safe data not be required to be granted?
My sister is pregnant and had the first Pfizer. I really want good data to be able to advise her about the second shot she has scheduled very soon