A miscarriage of statistics
Miscarriage rates in Pharma studies have been misrepresented for years in order to hide the effects of drugs on pregnancies. The COVID vaccine data exposes it all. Read on....

It’s been a busy week in the COVID misinformation world, since the US government finally acknowledged what we have been telling them for 3 years. Even then they lose no opportunity to propagandise mRNA gene therapies marketed as vaccines as you can see from this screenshot normalising the possibility of annual mRNA therapies.

At the same time we have been getting into the nitty gritty of whether miscarriage rates have been increased by the COVID mRNA injections, which I have been reporting on since the CDC refused to publish the publicly-funded V-SAFE pregnancy registry data, that was specifically intended to provide data on pregnancy outcomes of women who received a COVID vaccine whilst pregnant. This was updated again last week with a run-down of the available data, with multiple lines of evidence confirming that the miscarriage rate that reported in v-safe (and other sources) is about double what it should be:
Having played this game for 3 years now it becomes obvious when the trolls come calling that perhaps we are touching a nerve. This was very apparent last week when the mouse dared to bring up the miscarriage rates and was descended on with vitriol by a UK intensive care physician - Dr Caroline Sampson. Obviously an expert in this area…

In fact, that little troll fest resulted in Dr Sampson exposing her hatred for people she calls “antivaxxers” online and opened Pandora’s box to the #ECMOgate scandal. I’m not going to go over it here because John Sullivan did a great exposé of it on his substack here. It’s a compelling read given what has been happening in the UK in relation to COVID.
Ignoring #ECMOgate and getting back to the subject in hand… which is “What is the real baseline miscarriage rate?”…

The point of that tweet was to highlight the fact that a “new meta-analysis” by Rimmer (who has a very sparse publication history) was published in a major O&G medical journal1 yet the authors didn't understand what they were doing. They included ridiculously disparate miscarriage rates. The Kachikis study quoted there, for instance, included late pregnancies in the denominator - which you must never do when calculating miscarriage rates because you can't miscarry in late pregnancy (it would be termed a stillbirth). It's like taking a hundred men and saying that their uterine cancer risk was really low. Duh.
But, hold on. What’s this?

Bizarre. This is exactly the claim that we were making that Sampson (and others) took such objection to in that long thread which highlights exactly the problem with the over-reporting of miscarriage rates discussed in previous articles.
Why did Zauche report a 14% miscarriage rate when the actual miscarriage rate in the Zauche cohort was 7%?
And what happened to that Zauche cohort later, when more data was in?
Well I’m going to answer the question for once and for all so hopefully after reading this you will see what has been happening over the last 10-20 years with the reporting of miscarriage rates. I’ll summarise it first so you can see, and then present the proof.
The baseline miscarriage rate in studies of a normal cohort of women is about 5%.

For years, papers have been misreporting much higher rates of around 15% to conflate this number so that it becomes nearly impossible to demonstrate that a drug treatment is causing an increase in miscarriages.

The 15% rate is based on inappropriate use of a cancer survival model applied to miscarriage data.

When the data is analysed in the same way, we show that the miscarriage rate in the V-safe cohort is double the background rate.
Just to hammer home the point - because it is deliberately confusing - here’s #ThalidomideViki’s take on the argument

The normal range eh? Well why was your buddy Rimmer quoting Zauche at 7% in his own flawed paper that you promoted? And why this graph quoting up to 20% in the sensitivity analysis?
I’ll tell you. It’s because the v-safe pregnancy registry has a rate of miscarriage which is at least double what it should be, and Viki Male and her entourage of sycophants are desperate to confuse you into believing that it isn’t.
Xu and the false analytical methods
In order to explain what publications have been doing in journals for the last 10 years or so, I need to break it down a little bit and explain some things about calculating miscarriage rates.
A normal person would understand that the miscarriage rate is the number of miscarriages out of the total number of pregnancies, expressed as a percentage. So if you had 100 pregnancies and there were 5 miscarriages, the miscarriage rate is 5%. In the Zauche figure about it would be 165/2203 = 7.5%
The Naert study used in the “curious case” adopted this approach and is explained in that article. The overall miscarriage rate in their cohort was 5.4% (132 miscarriages out of 2446 pregnancies).
Most miscarriages (about 70% in Naert and Zauche) occur in the early weeks, between week 6 and week 10. Miscarriages occurring after week 13 are uncommon.
Pregnancy gestations are recorded as weeks from the last menstrual period (LMP). Therefore conception occurs at around “2 weeks of gestation” and the first missed period would be “4 weeks of gestation”. This is established terminology that causes confusion, even to doctors and nurses.
Weeks 0-4 therefore do not exist in any meaningful sense in pregnancy research studies.
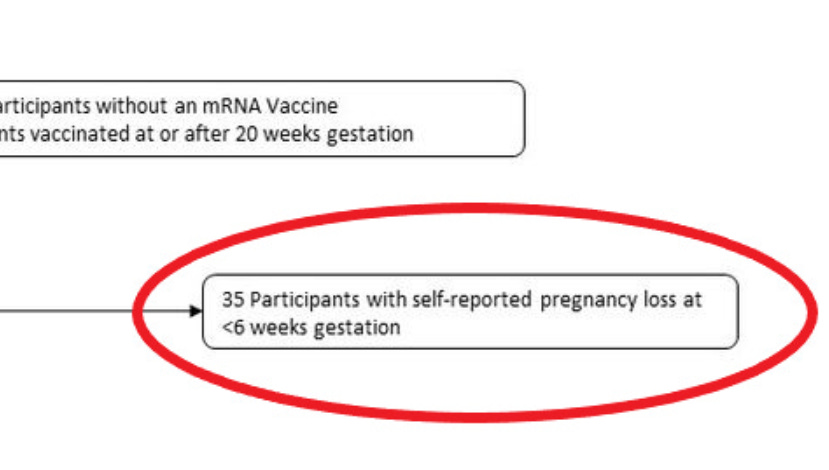
Weeks 4-6 cannot be reliably assessed in studies, as the pregnancies are usually too early to report. Most women will do a pregnancy test in the week after a missed period and will then look to report this to a relevant practitioner (GP, OBGYN or midwife) in the subsequent days. It is therefore unusual to be seen before week 6 and assessing the proportion of lost pregnancies in this time period is impossible because you do not have a denominator of “all pregnancies”. They are therefore usually excluded - as Zauche did (reported previously)
Miscarriages cannot occur beyond week 19, these are either excluded from studies or are termed stillbirths2. This definition varies by jurisdiction3 and so can be higher. For the purposes of miscarriage comparisons however the risk of miscarriage is essentially removed by week 20.

So, who is Rhongui Xu and why is she relevant?
Here she is. PhD from University of California San Diego. A mathematician whose expertise is in survival analysis. So, not an OBGYN and not somebody who really understands the subtleties of pregnancy like James Thorp and his colleagues. She does understand survival analysis and computing. Great.

What’s survival analysis? Well it’s what we use to look at cancer data and whether a specific treatment has improved your chance of surviving. Here’s a good example

The main difference between survival analysis like this and a “raw” analysis (just dividing the miscarriages by the number of pregnancies) is that the survival analysis caters for the time from the point at which you are diagnosed and adjusts for the length of time of follow-up. This is because in a cancer cohort you are getting people into your study at different times (sometimes over years) and so you have different length of time of follow up. For instance if your study runs from 2001-2006 and you publish in 2007 you will have 5 year data for only the patients recruited in 2001-2002. For the most recent recruitees you’ll only have 1-2 years’ data. So any predictions on survival will have to be based on modelled estimates of survival using the data that you have.
Another issue we have in cancer survival data is that people die. So the denominator (the number in the overall cohort) changes.
If you start off with 100 patients and 50 die in the first year, your death rate is 50%. If another 30 die it is now 60% (30 out of the remaining 50) so it went up in the second year, and overall the death rate is 80%. Confusing, eh?
In order to compare treatments under these circumstances we use a proportional hazards model to give us a Hazard Rate - basically the relative rate of an event between two groups calculated over time. It’s an estimate based on the data but not as simple as just comparing one group with a 40/50 death rate against another group with 20/50 death rate and saying the death rate is half.
As another example if one group had 20 deaths out of 50 people with only one year of follow up but another group had 20 deaths out of 50 people with 5 years of follow up you would expect the second group to have fared better. In order to assess this you would plot the events over time. You’d probably find the second group had only 10 deaths in the first year so are doing better than the second group.
So in 2011 Dr Xu must have thought it would be a great idea to apply the same model to pregnancy and miscarriage data and confuse everybody in the world. So she wrote this paper which basically told the OBGYN community “don’t bother analysing miscarriage rates because it’s too complicated for you” (a special thanks to Clare Craig for pointing me in the direction of this paper).
Well of course, it’s not - because normal people just want to know how many miscarriages out of how many pregnancies. The problem is that Xu’s model has been used in many other studies of miscarriage rates including our famous Lauren Zauche - the citation is on Xu’s publication.

The problem is that Xu doesn’t really seem familiar with the problem of miscarriage counting (per the list I have put out above). Just as an example, Xu’s model includes the adjustment for “left truncation” which is basically saying “well we don’t see pregnancies before week 6 so we need to adjust for this” - ignoring the fact that pregnancies don’t even exist before week 4. She includes week 0 in her adjustment (yep, that’s even before the wine and Barry White have chance to do their stuff) …
Here is the relevant passage from the small print in the paper. I’m sure Lauren read it and understood how problematic it is (OK that was sarcasm).

The bottom line is that this kind of cancer-based survival analysis is really not appropriate for miscarriage analysis for the following reasons
Left censoring to 0 weeks is nonsensical as explained above, because you can’t be 0 weeks pregnant, or 1 week, or 2 weeks or 3 weeks.
Although the pregnancies end with a miscarriage (or termination, which are not included in the adjustments) the ongoing pregnancies are only counted to 20 weeks and can therefore all be captured in the study time. This is different from cancer survival analysis which goes on for years. Therefore the pregnancy cohorts can be directly comparable with raw proportions of outcome because they actually have a defined end point.
Let’s play a game
So now we get to play a little game. It’s called “let’s pretend we believe in survival analysis for miscarriage data”. Catchy title I’m sure you’ll agree.
I do think we’re entitled to play games as this seems to be a common theme amongst the “this novel mRNA vaccine is absolutely safe in pregnancy” brigade as demonstrated here by Viki.
And her compatriot Graham in one of many similar bizarre posts
James Thorpe, OBGYN, pushes back succinctly.
So back to our game. What we are going to do here is recreate the early Zauche data (published on the 9th August 2021, when the first cohort of the V-safe victims data had been recorded) and the mature Naert data we have referred to many times and referenced by James in the tweet above.
Then we’re going to plug that data into R and run a survival analysis.

Now, just to reiterate. Survival analysis here is not appropriate for the reasons above and also the fact that study participants are being added at different gestational ages. So it’s not even straightforward as to where you put these patients and whether you count them in relation to time of exposure or time from which they were admitted to the study, or the weeks of gestational age. Clearly the overall risk has to be lower for the Naert data set (5.4% overall) compared to the Zauche dataset (7.5% overall) and the only way we can represent this in the survival analysis is like this, with stratification for the cohort (Naert vs Zauche):

And we can even do a fancy forest-plot kind of analysis showing the higher hazard ratio of the Zauche cohort compared to the Naert cohort.

Note that the p-value (the probability that the result - that the Zauche cohort had a higher miscarriage rate than the Naert cohort - was obtained by random chance) here is (just) less than 5%. This is usually considered statistically significant.
So we now have shown another way of looking at the data - by treating the cohorts in exactly the same way (even excluding those under 6 weeks as Zauche did) - that shows that there was a safety signal for miscarriage in the Zauche data.
You should hopefully be able to see from the survival curves that the estimated miscarriage rate (1-survival) in the Zauche cohort is nearly double that of the Naert data heading towards 20% rather than 10%. Note these are estimated survival rates based on the prevailing data by weeks, not the “raw” rates. The “raw” rates are 5.4% (Naert) vs 7.5% (Zauche/CDC)
Yet, despite our requests to release the data in full, the CDC and Lauren Zauche kept this data to themselves.
Note: the survival analysis above is a model based on the data available (which is aggregate data). It is an incorrect model for the reasons provided but I will happily update it if the raw data is provided. One of the main differences between the Zauche and the Naert data set is that the Naert data set allocates miscarriages according to the gestation that the patient presented to the study. The Zauche data allocates the miscarriage to the week at which the miscarriage occurred. It is impossible to match these perfectly without the raw data.
But the story gets worse.
Let’s get raw
Now that you can see the difference between a “Raw” miscarriage rate and a “Modelled” miscarriage rate we can start comparing apples to apples and oranges to oranges, which was the purpose of this article.
If we remain in the “raw” space we can now show how the Zauche miscarriage rate skyrocketed after this initial paper.
From what is shown above you can see that the Zauche (CDC-vaccine) cohort, when it was initially published, had a “raw” miscarriage rate of 7.5%. But you will hopefully also remember that Zauche republished the data more recently, as a poster presentation to the CDC.
What was the “raw” rate? Well I went over it here because it was presented without the correct denominator (only first trimester participants), and I adjusted it to make that correction.

So the same dataset, analysed the same way, showed an increase from an already-high 7.5% to an unbelievably high “raw” miscarriage rate of 11.1% - or really 11.9% when you add in the induced abortions (that seem to be mostly related to fetal anomalies based on our recent report). This level - when assessed in a comparable way - shows a definitive doubling of the miscarriage rate from baseline. Bear in mind that Zauche herself said that pregnancies before 6 weeks were excluded from their analysis, so this cohort is directly comparable to the Naert cohort.
Bear in mind as well that any increase in miscarriage rate will be predominantly confined to those who have received the drug in the 6-8 week window. In fact in the thalidomide scandal, of the estimated 40 millions of doses given, to one million women, there were “only” an estimated 20,000 vicitims - 2% of those that took it. Its effects were almost entirely restricted to the 6-8 week window, so if you took the drug after 8 weeks you wouldn’t have shown up as a problem. And it was a problem, as the statue of Alison Lapper in London is testament to:

The point being, that the increase in miscarriage rate from 5.6% to 7.5% or 11% is likely to be entirely driven by the minority that took this treatment in the 4-8 week window.
Because we don’t have that data and the CDC won’t give it to us, we are left having to fight for the truth with the breadcrumbs of data that we have been given, that have been wrapped up in a shiny bow with a “nothing to see here” tag.
The bottom line here is that there was a huge safety signal for a dramatic and unprecedented increase in miscarriage rates, predicted by the pre-clinical animal data and obvious if the data were analysed properly by people who don't have a vested interest.Who is Lauren Zauche?
It does seem that, after the first paper from Tom Shimabukuro, Lauren Zauche was cast into the limelight as the CDC’s front advocating for the “safety of the COVID vaccine in pregnancy” con.
So who is she? She is nominally a paediatric nurse, with a sparsity of publications in this space and no significant history of data analysis. You can see her publications (in both her current name of Lauren Head Zauche and her previous name of Lauren M Head) here on pubmed.gov. She has never been a supervising author on a clinical paper and 3 of her papers were written with the inclusion of her husband who is/was a chaplain at Emory, with no obvious role in the study(s).
When we look further at Dr Zauche it gets somewhat insidious. This is her LinkedIn profile, proudly displaying her role with the CDC and… “LUKOS”.

Who are Lukos?
Lukos is Greek for “Wolf”. When you follow through to theorg.com’s analysis of the company you can see that it is a Military Contractor. And it also seems that it has taken over responsibility for the V-safe pregnancy registry, which presumably now falls under military secrecy regulations.

So there we have it.
Good luck getting data out of the V-safe registry. And good luck getting any accountability out of the lies told about the “safe and effective in pregnancy, honest, even though we haven’t actually tested it and we ignored all the safety signals staring us in the face” COVID mRNA vaccines.
And good luck getting Viki Male and Kevin Ault to stop promoting these failed therapies to pregnant women whilst keeping their own vested interests hidden.
Nothing to see here. Thalidomide, Diethylstilbestrol, Primodos, Valproate and probably many more drugs caused untold serious harm in pregnancy and were covered up by the Pharma companies and the media, until the damage had been done. For thalidomide there was a safety signal in a higher rate of miscarriages that was ignored.

But I’m sure that the thalidomide trio: Viki Male (who has never treated a pregnant woman), Kevin Ault (who was a member of the very ACIP board that authorised the widespread use of a never-tested drug on pregnant women, ignoring decades of safety rules and regulations) and Teresa Kelly (who pushes COVID vaccine propaganda on behalf of Project Halo according to her bio) have a crystal ball to tell them that these miscarriage signals can safely be ignored. And I would think that Lauren Zauche is amply protected by the military for whom she appears to be working.
Because if they don’t, they might need a very good lawyer.
Welcome to Gilead. Part 7

The static URL for this paper is here but at the time that it was being touted by people like Viki Male and Caroline Sampson (and Mike Rimmer the author) the PDF that was posted had redactions, which is unheard of for a medical paper. The redactions related to the titles of the forest plots and were bizarre. The URL posted above in the main text is an archive link to the live PDF at the time of this online discussion.
https://www.aihw.gov.au/reports/mothers-babies/stillbirths-and-neonatal-deaths-in-australia/contents/technical-notes/definitions-used-in-reporting
https://www.who.int/health-topics/stillbirth#tab=tab_1
A big irony here is that the more they have tried to stifle scientific debate and discovery, the more public they have made it, drawing many, many more people in than probably would have happened otherwise. The outcome is likely to be that decades of malfeasance will be uncovered and, hopefully, generations to come will be spared from the Harmaceutical Complex.
Thank you I have been following the ‘debate’ but it gets complicated for those without a background appreciate the time you took to produce a clear and concise summary and also for the Kenny Rogers share - 🤣