The Pfizer Job
How Pfizer carried out the biggest pharma trial heist ever - and the regulators swallowed it hook, line and sinker.

Remember this?
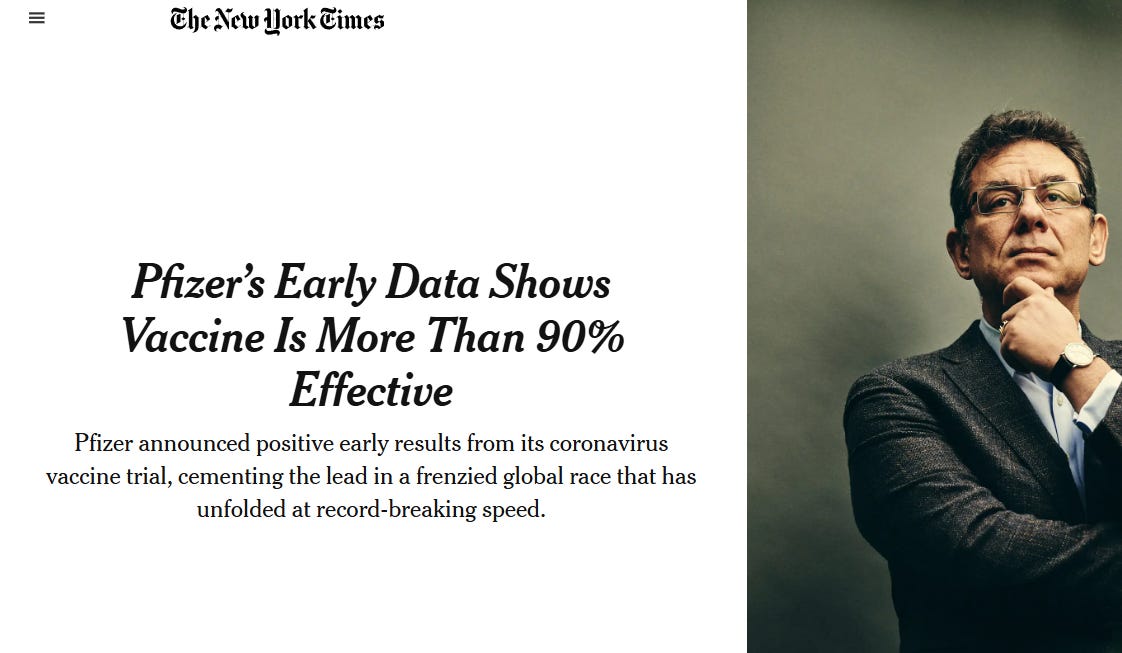
“Pfizer’s vaccine is more than 90% effective”.
Headlines repeated around the world and more importantly by the regulators FDA, TGA, EMA and MHRA.
The “real” statistic was actually 95%. Yep, Pfizer and the FDA concluded - after one of the quickest and largest randomised controlled trials in pharma history - that receiving a Pfizer COVID vaccine would give you only 5% of the risk of “catching COVID” than someone who didn’t receive their product1.
Just to reiterate - this was about COVID infection. No claims on severity, hospitalisation or death were made by Pfizer. The FDA agreed that Pfizer’s trial showed that for every 100 people who were not vaccinated and “got COVID” only 5 vaccinated people would “get COVID”. And remember this is COVID infection (testing positive), not anything else.
FDA’s analysis of the available efficacy data from 36,523 participants 12 years of age and older without evidence of SARS-CoV-2 infection prior to 7 days after dose 2 confirmed the vaccine was 95% effective (95% credible interval 90.3, 97.6) in preventing COVID-19 occurring at least 7 days after the second dose (with 8 COVID-19 cases in the vaccine group compared to 162 COVID-19 cases in the placebo group).
Putting this another way, for every vaccinated person you met who had COVID you should have met at least 24 vaccinated people that didn’t ever have COVID. Given that most of the vaccinated population actually “got COVID” - many of them multiple times, that sounds impossible, right?
That’s because it was.
Yet the trial itself showed 95% reduction in the risk of infection and was published in the infamous New England Journal of Medicine (the same journal that published the fraudulent Surgisphere study) on the 10th December 2020.
Dates Matter
As a background to the first red flag concerning this trial and subsequent “emergency approval” of the Pfizer COVID-19 vaccine it is worth noting some dates.
The first patient recruited to the study was July 27th 2020.
By 31st August 2020 half of the participants had been recruited, meaning that less than half the participants had follow-up of at least 75 days from the first injection. Given that you were supposed to need two weeks after the second injection (35 days) for it to “work” this means that half the participants had follow up of less than 47 days for the “effective dose”2.
The original submission from Pfizer to the FDA happened on November 20th 2020. The “data cut-off” for the trial - the last day that COVID infections could be registered - was November 14th 2020.
The VRBPAC meeting (Vaccines and Related Biological Products Advisory Committee) at the FDA met on the 10th December 2020, the same day the trial was published.
The VRBPAC assessment document3 for the Pfizer submission was written on the 7th December 2020, just two weeks after the submission was made - and having had to assess a trial with 44,000 participants.
This median of 47 days was the basis on which the approval was given, but it gets worse - much worse.
In fact we are going to show that the whole study was a sham and that there never was a benefit - at all, never mind “95% reduction in infection”
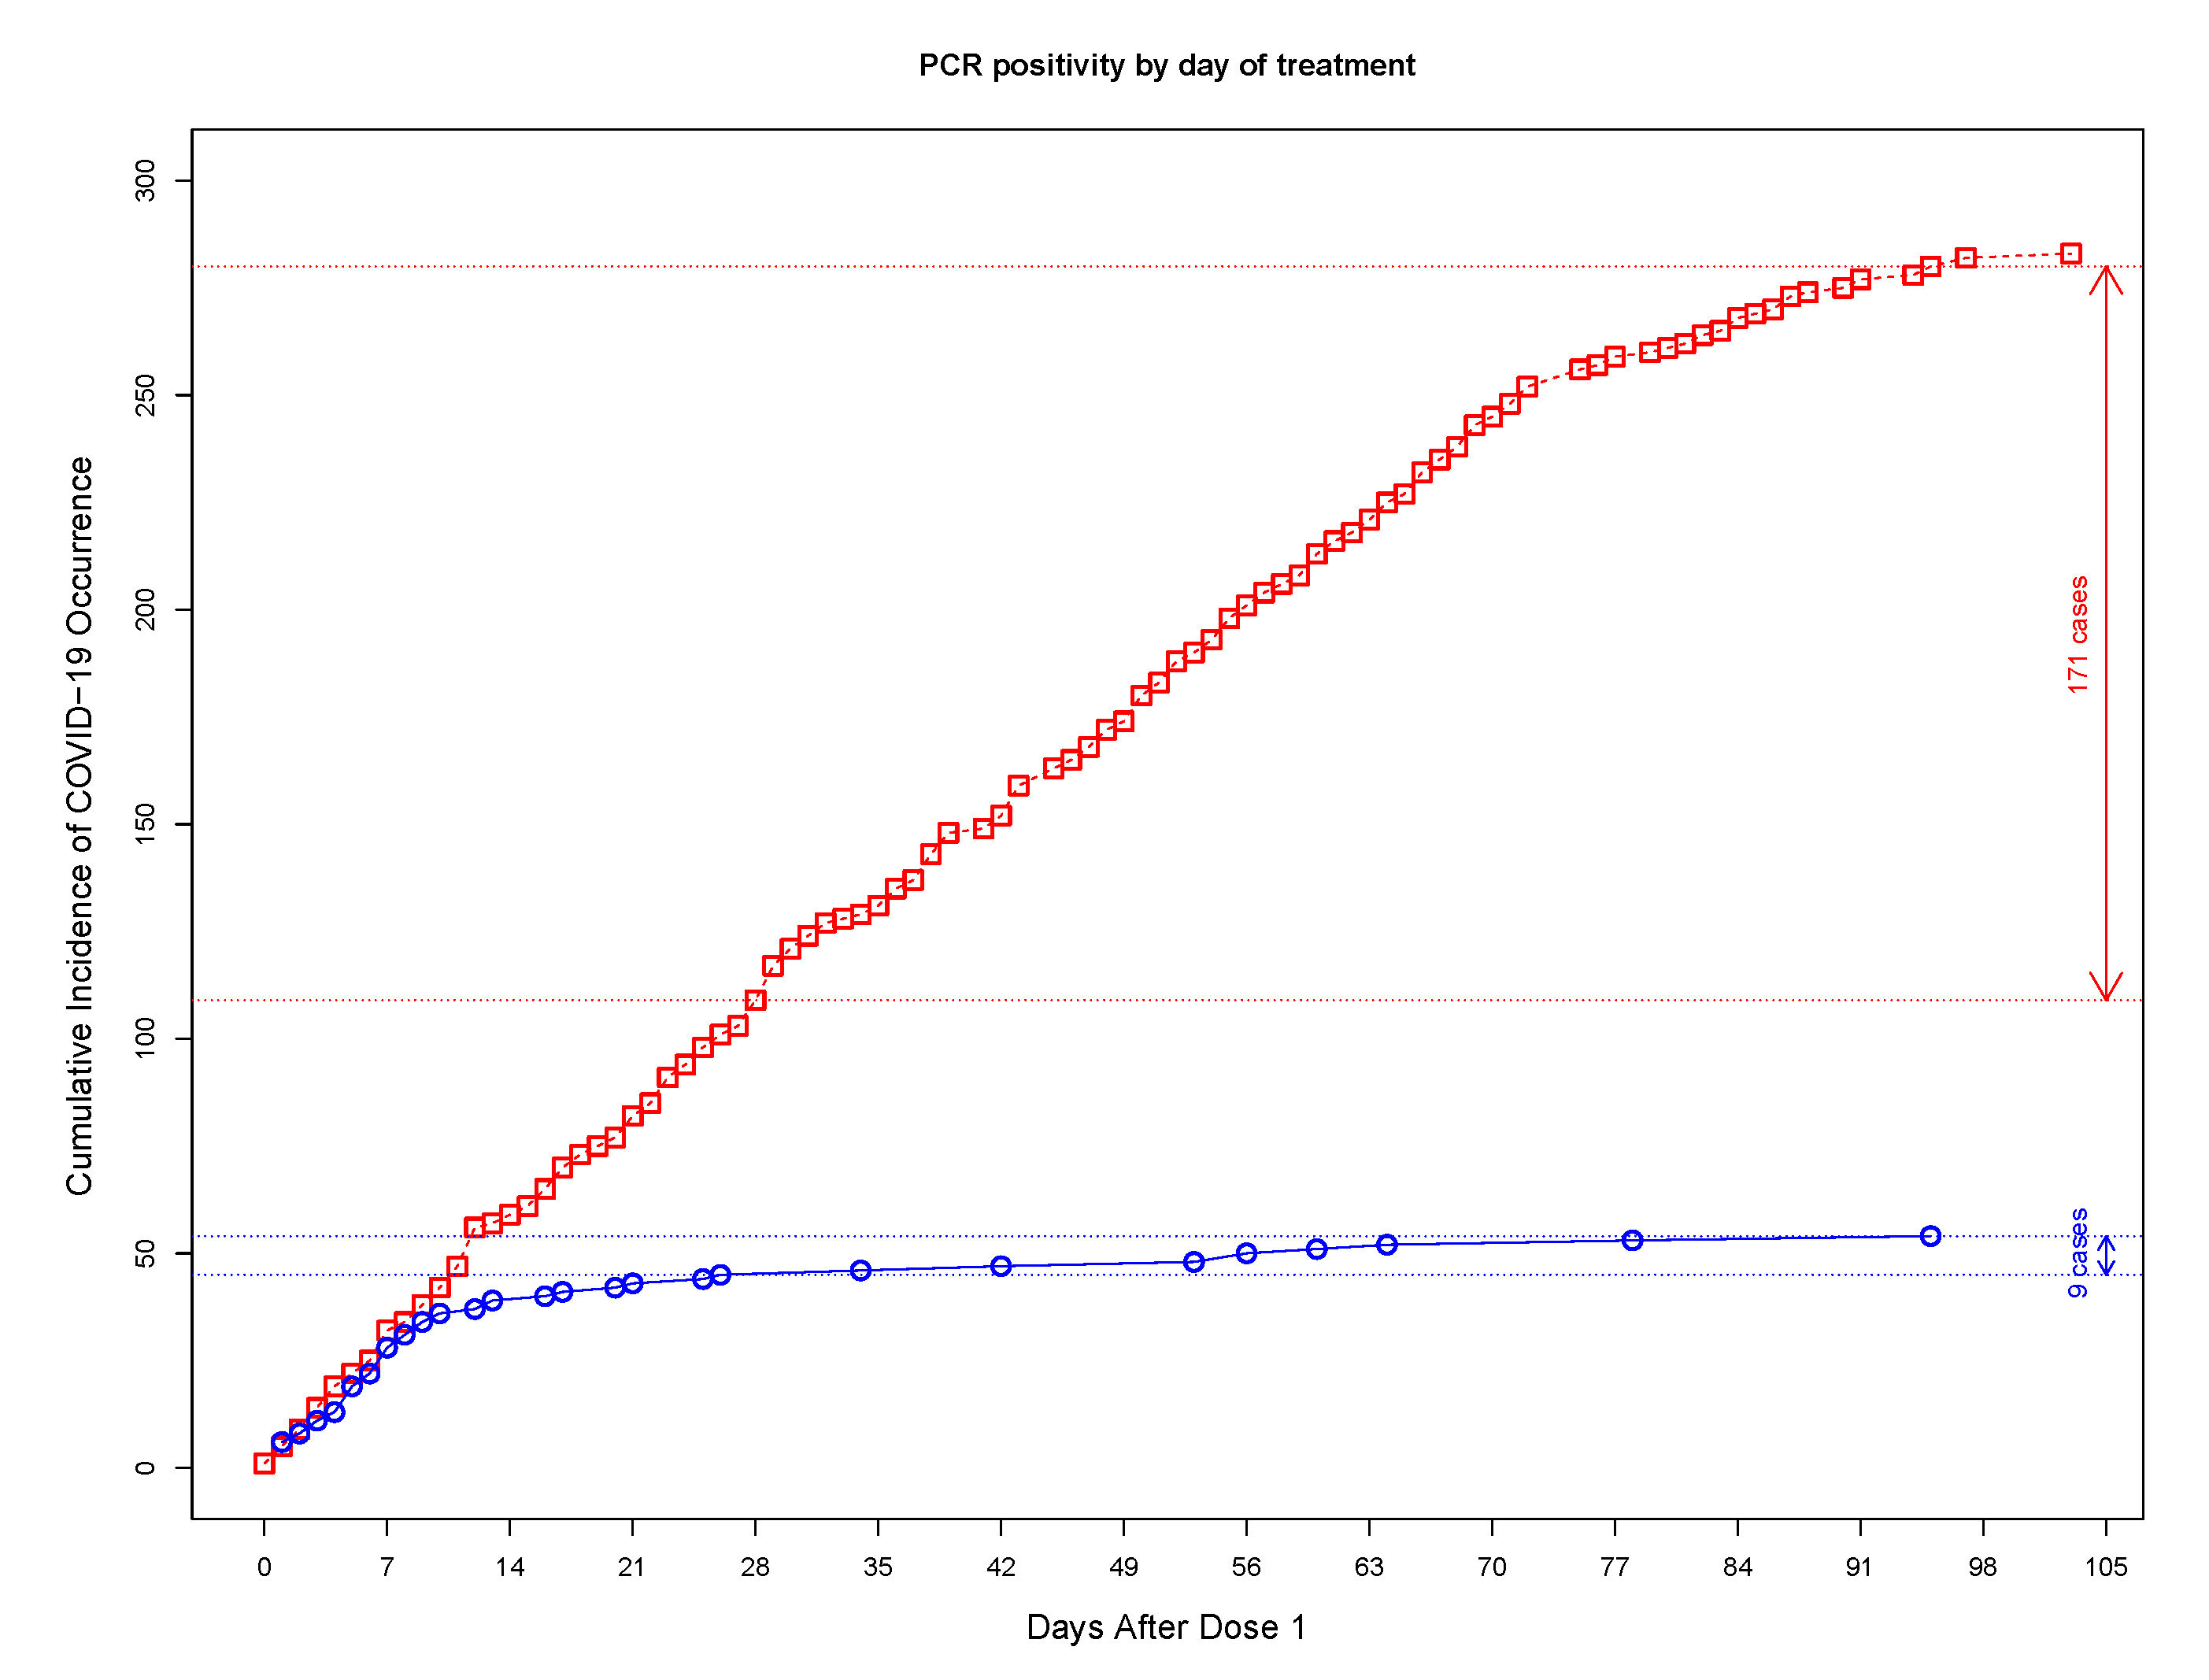
Here is the chart provided by Pfizer that they used to show that there was a 95% reduction in infection. It’s impressive. The red line is the “placebo” group and the blue line is the “vaccinated” group. And although they initially start off getting infected at the same rate - after about 10 days after the first jab, the vaccinated pretty much stop getting infected at all. A true miracle vaccine.
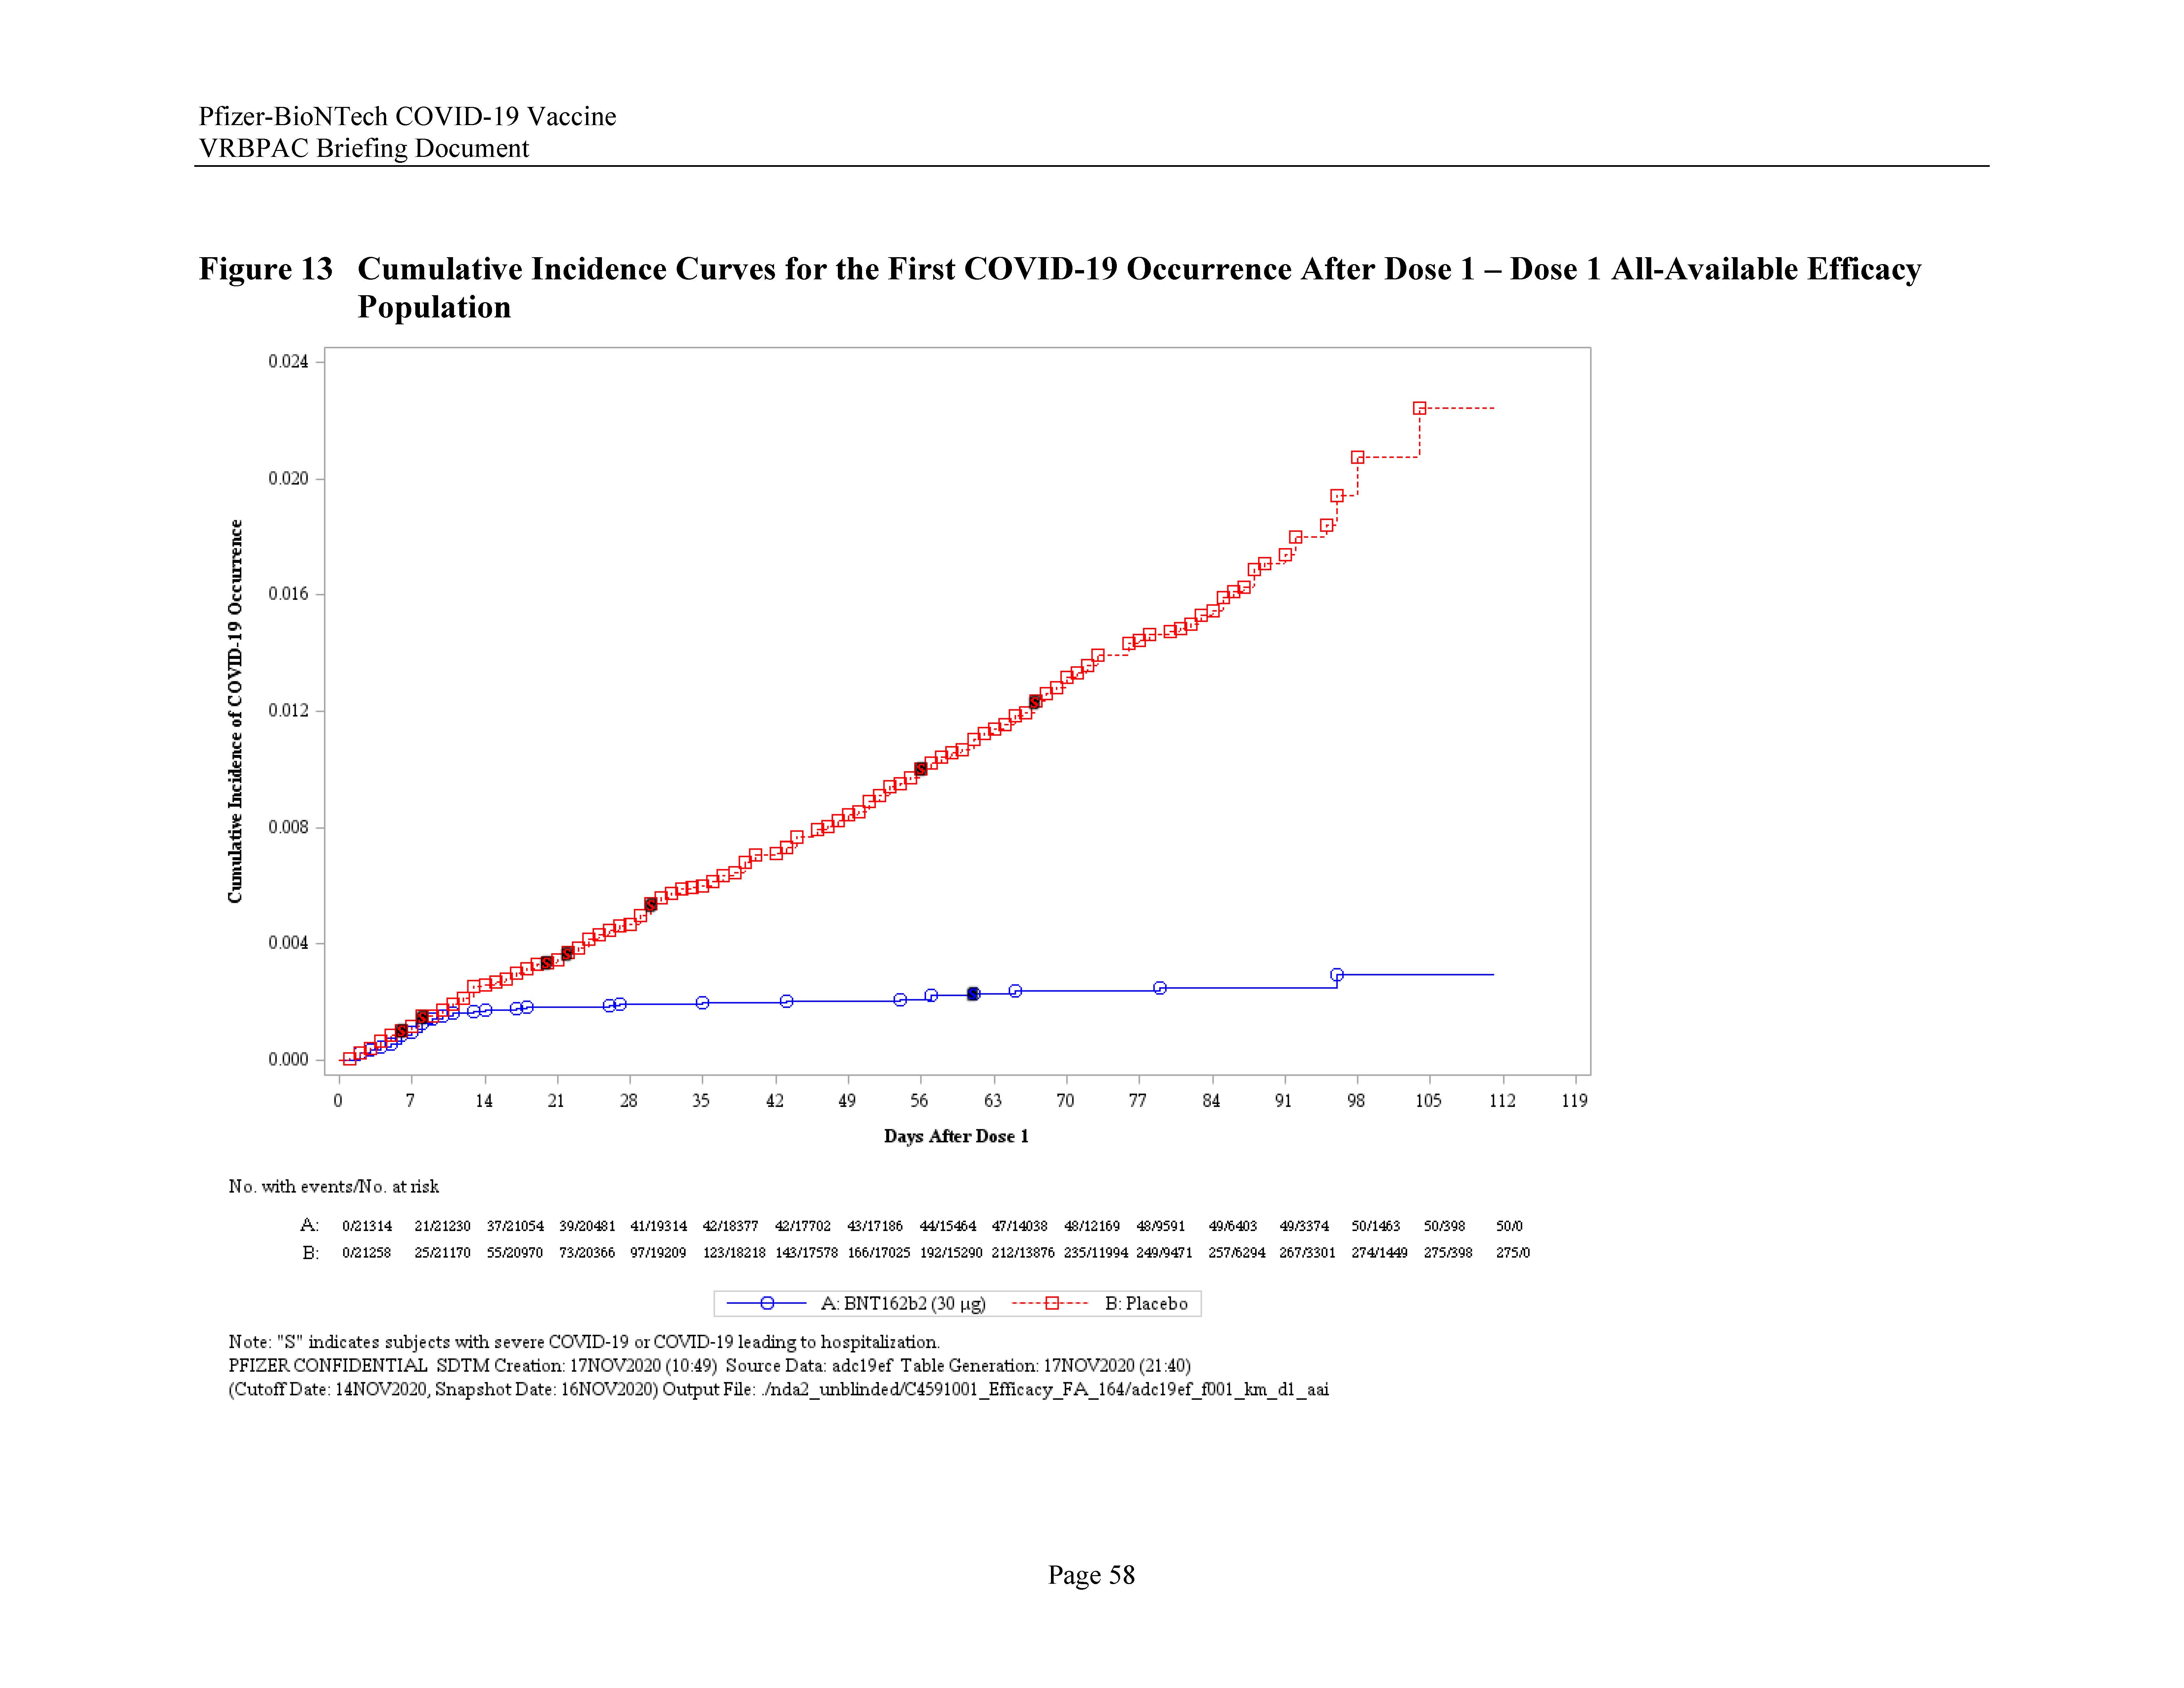
Note that his chart is by “day after dose 1” and not “day of the year” or “day of the trial”.
The point of mentioning the dates is not only to show that the approval was made on the basis of 47 days of follow-up for most patients but was also made in 1 day, because the VRBPAC meeting was the 10th December 2020 and the EUA approval was declared on the 11th December 2020. It is of course not possible that such a decision could have been made overnight and so the implication is that this was a pre-agreed approval and all that needed to happen was that Pfizer provide data that shows that, in the group that were followed up for more than 35 days, there were less infections in the vaccination group.
And we are going to see that this was all planned to happen by around the 20th of October, around 4 weeks before the data cut-off date.
What’s “COVID” according to Pfizer?
Here comes the next important part of the hustle.
For most of us, “COVID” is a clinical syndrome signified by a viral infection that causes symptoms. Those symptoms invariably involve a fever and lethargy. For some people it involves a cough or runny nose. And when “severe COVID” happens, if it does, that almost always involves a post-viral pneumonia - just like the 1918 “Spanish flu” and basically every other respiratory virus ever - as I wrote about extensively here.

If you don’t have any symptoms you can’t really have “COVID” or any similar illness of any significance. Testing positive on a PCR test is irrelevant if you don’t have symptoms (why are you even testing?) but if you do have symptoms it’s highly predictive of a viral infection with SARS-Cov-2.
So you would think that the definition of “COVID” in the Pfizer trial was something like “symptoms of respiratory viral infection with fever cough and a positive PCR or lateral flow test conducted at the local health authority” wouldn’t you?
Oh no. This is the case definition in the Pfizer protocol4.
Efficacy will be assessed .. If, at any time, a participant develops acute respiratory illness (see Section 8.13), for the purposes of the study he or she will be considered to potentially have COVID-19 illness.. the participant should contact the site, an in-person or telehealth visit should occur, and assessments should be conducted… will include a nasal (midturbinate) swab, which will be tested at a central laboratory using a reverse transcription–polymerase chain reaction (RT-PCR) test… The central laboratory NAAT result will be used for the case definition
There is one phrase hidden in there that not many people noticed but prompted this tweet over 3 years ago…

And the phrase of interest is “The central laboratory NAAT result will be used for the case definition”.
The tweet is basically asking why - when a large proportion of the trial participants were recruited in Argentina - you would send your “suspected COVID” swab all the way to New York.
Well the answer becomes obvious when you realise what the “central laboratory” is - it’s Pfizer’s lab in Pearl River, New York. How do we know that? Because it’s in the documents that Pfizer and the FDA tried to withhold for 75 years - until Aaron Siri took the FDA to court to provide those very same documents.
[It’s worth noting at this point that those documents in total work out at over 2 million pages, so I hope readers will forgive me for taking a long time (arguably 3 years) to produce this article which is based on analysing and verifying the data in them. It’s a lot of work, and anybody who’s looked at these files will know that it’s not possible to review them properly in 2 weeks]
And here is the confirmation5 that the “central laboratory” was at Pfizer’s vaccine HQ…
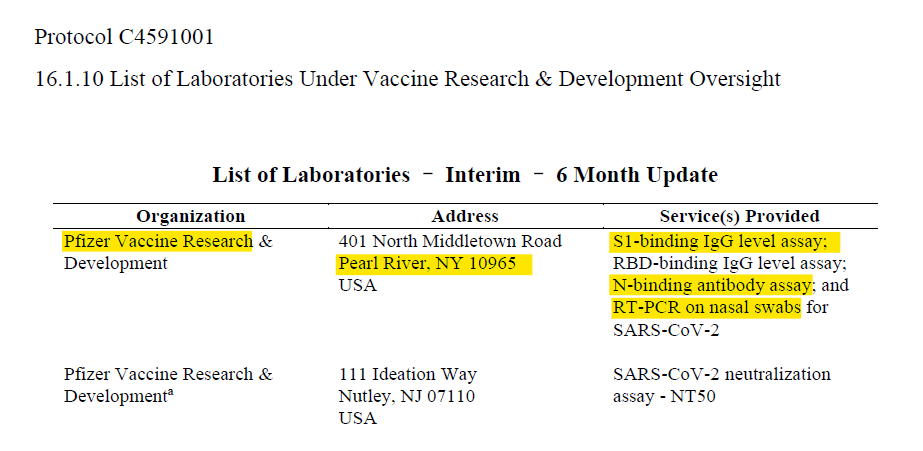
… Which means that the people that decided whether a swab would be marked as PCR positive or negative - which was the only test that mattered - were Pfizer.
Nothing to see there, obviously. But it gets better.
VRBPAC SHMERPAC
The FDA’s VRBPAC meeting was held on the 10th December 2020 and comprised a bunch of people who appeared completely incompetent - and in some cases didn’t appear to know what time of day it was, or how to use zoom.
Except Doran Fink, who gave a polished presentation, that almost looks like it was written for him, explaining how the FDA had been investigating this trial data “for months”. That was despite (supposedly) having no clinical data in that time - so that was not possible. To clarify, unblinding in the trial was not allowed to have happened until after November 14th, 2020, so it seems that Doran is throwing Pfizer under the bus by telling us that there was some way that Pfizer knew who was in which arm before the 14th November6.
Neither was it possible for Doran Fink himself to have analysed such a quantity of data because he had no experience in handling large clinical data sets, so it certainly wasn’t him that did that analysis.
Doran was rewarded with a plum job at Moderna for his efforts to put lipstick on the Pfizer trial data… and if that wasn’t good enough he’s now rocking it at the home of the pharma vaccine cartel - GSK. Absolutely nothing to see there then, because the “revolving door” corruption at the FDA is just part of the furniture.
And here he is at the VRBPAC meeting itself telling us how the FDA (i.e. Fink and friends) did a “thorough and extensive” review of the 44,000 participant study in no time at all but that actually he (and his elves) had been doing it for months. As well as working over thanksgiving - you know, just to really hammer it home that they’d been working on it.
Except that they didn’t need to work on anything because there is nothing at all to stop Pfizer ghost writing the whole “analysis” for them. It is certainly improbable that Doran Fink produced the 60-page document.
But the important bit is that Pfizer already knew by the 9th of November that the vaccine had “worked”. So did all those “mainstream” media outlets and the WEF.

Which was all a bit naughty because, if the data cut off was the 14th November Pfizer couldn’t have known before that date that they had achieved anything at all, unless the “unblinded team” that they conveniently had as part of their protocol had told them.
And although they had an “unblinded team” who knew which patients were in which groups they didn’t need that information, because they had another way of finding out, which we’ll come back to soon.
What Did Doran Do?
Well, apart from earning himself a cushy job with pharma (twice), after selling the COVID vaccine efficacy line to the world in order to get the EUA (emergency use authorization) approval done and dusted in less than 24 hours, the answer is likely not very much at all.
It is also worth an honourable mention to Moderna here, who managed to achieve a similar EUA approval only 7 days later (having played the same “central laboratory” trick). Yes, that’s right, while Fink and crew were giving up their thanksgiving Turkey to sift through the 44,000 clinical trial participants data for Pfizer they were also apparently “thoroughly assessing” the 30,000 participant Moderna trial. Either that, or any analysis they pretended to do was ghost written for them by pharma (again).
But getting back to the Doran Fink analysis of the Pfizer trial… At the VRBPAC meeting itself it was actually Susan K Wollersheim who gave the statistical presentation. Her ability to analyse a 44,000 participant clinical trial in record time is legendary as she has never published a clinical research study7. Therefore the probability of Wollersheim having analysed this 44,000 participant data is close to zero.
Here she is with her blue light filter glasses8 on noting that the FDA also had the inside information on the fabulous “95% efficacy” figure in October.
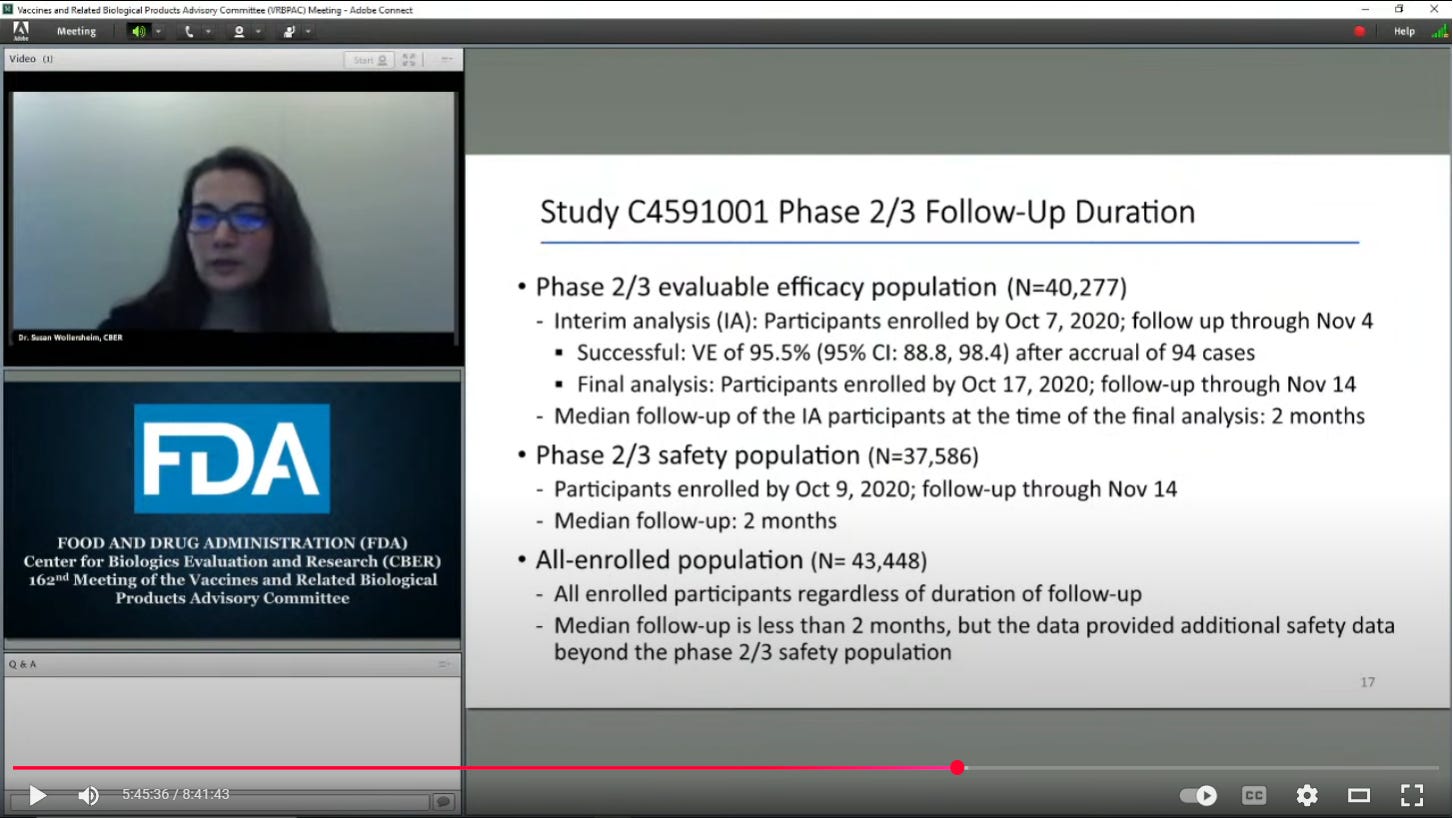
Of course only a cynic would suggest that this “miraculous” result could have been revealed to the US population before the 2020 election so that they didn’t have to set up special ballot drops but that’s a story for another day.
If you actually watch the VRBPAC monologue from the blue-tinted Wollersheim you can see that she is just reading a script. It’s no surprise because there is no way that these people were doing this analysis. They don’t have the skill set and the amount of work required is incredible - particularly for someone who is a practising doctor and therefore doesn’t have the time.
For context, what you will see below in my analysis is just a part of what we have been working on for over 3 years. When I say “we” I mean a handful of people with the skillset to look through the Pfizer data that was eventually released over 2 years by the FDA. That was the expedited release after the court quashed the FDA’s attempt to take 75 years to release that data. It is literally millions of pages and there is not a chance in hell that the Susan Wollersheims of the world could have provided a full re-analysis of the data in two weeks.
Just working on this one aspect of the Pfizer data fraud (the subject of this article) has taken me 3 years on and off. Similarly, OpenVAET spent around 2 years collecting examples of where Pfizer cheated enough to have influenced the results to the “right” answer just on the basis of “errors” alone.
In comparison, one of the data reviewers from the FDA, Ye Yang, the lead statistician at the FDA, concluded9 in just a few weeks:
No major statistical issues were identified for the safety data during review. A higher percentage of subjects in the BNT162b2 group reported solicited local and systemic reactions than placebo recipients in both the younger (16 to 55 years) and older (>55 years) adult age groups after each dose. There were no major imbalances in reported SAEs, AEs leading to withdrawal, or deaths between the treatment groups at one month and up to six months after the second dose or unblinding/data cut-off. (b) (6)
There is evidence of reactogenicity associated with BNT162b2; the overwhelming majority of events were of mild or moderate severity and short duration. There was no evidence of increased risk of unsolicited SAE or death associated with BNT162b2 in Study C4591001. I defer to Drs. Susan Wollersheim and Ann Schwartz’s clinical review memo on the overall safety conclusion for BNT162b2.
Nice job, Ye Yang. Not a single mention of Brook Jackson’s fraud complaint registered with the FDA in September 2020. Everything rosy in the garden.
So I think we can safely say that the FDA have no interest in looking for fraud in these kind of trials. In fact it’s very likely that the FDA didn’t analyse anything at all other than rehashing what Pfizer gave them.
What nobody has done is what I’m going to show you now.
The Pfizer Heist (aka “how they did it”)
Background
To understand what Pfizer needed to fake the trial result requires asking two questions:
How many infections should there have been in each group if the claims were true?
Did the antibody testing corroborate the numbers?
So, let’s start with looking at the number of positive tests according to Pfizer.
This is directly from Susan Wollersheim’s presentation, cropped for readability
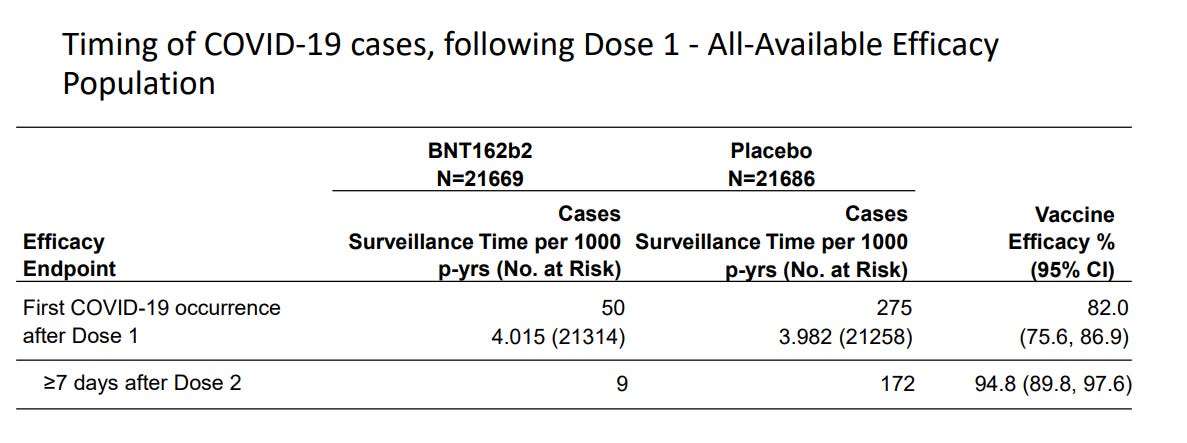
I’ll just explain the numbers for a minute, because it’s important.
The first line shows 50 cases in the vaccine arm and 275 cases in the placebo arm for an overall efficacy of 82% (that is, 50 cases is 82% less than 275 cases for a similar number of participants in each arm).
[For the record, these numbers (50 vs 275) change slightly depending on which files from the Pfizer dump are used as you might notice in the charts below.]
The second line is where the 95% comes from, when counting cases only happening after 4 weeks from the first jab.
And this is where the miracle comes in because, basically, they stopped accumulating cases (in the vaccinated group only) for a specified time period in order to make the cut.
In order for this to happen there either had to be a magic trick or the vaccine really works (and your 24 vaccinated friends who got COVID must have imagined it).
Just to set the scene as to how the trick happens here’s a little reveal of a Penn & Teller (incidentally not nice people10) sketch where the punter believes that the magicians correctly guessed the right amount of money in her hand. In fact they had created the scene in such a way that whatever amount of money she picked up, the pizza guy would ask for the right amount.
And it’s a bit like that with the Pfizer C4591001 study which sold the vaccine to the world… They knew they were going to hit the “95% reduction” from the beginning.
I’ll show you.
The PCR Hustle
Let’s start with the PCR tests. This is a recreation of the PCR test results from one of the documents released in the first tranche of the Pfizer FOI release (in 2022), but instead of plotting the graph as “days from dose 1” we plot the graph from “days from the start of the study (i.e. 27th July)
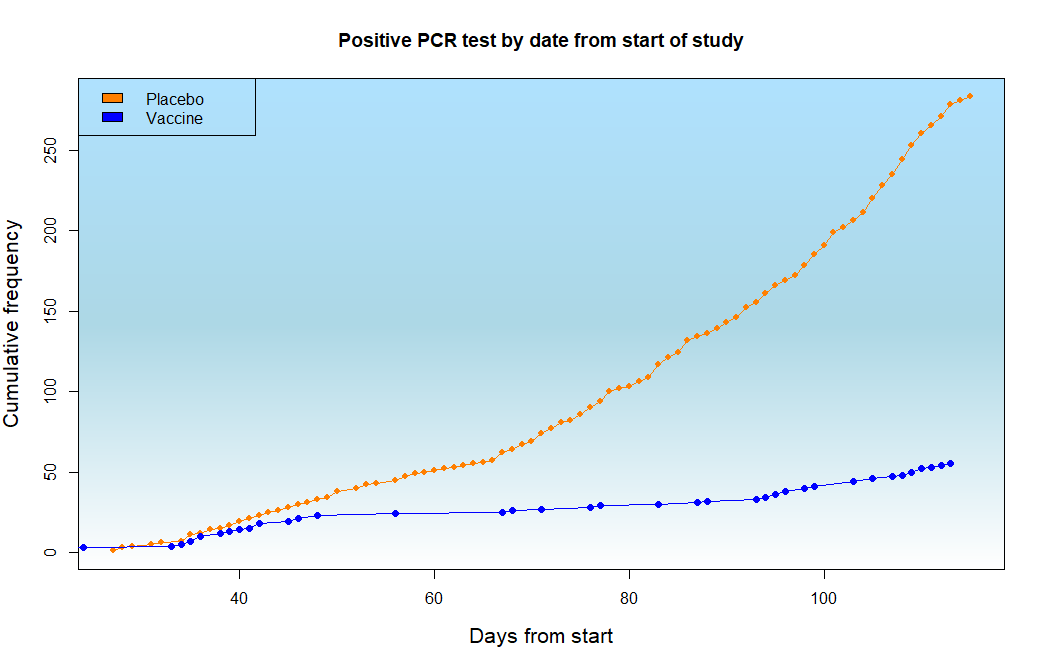
You can see that the numbers match the provided data (275 vs 50 cases) so that’s a good sanity check and in fact we can recreate the “days from dose 1” graph from the same data11, just to confirm that we have the correct data.
Now, other than the the fact that the vaccine group has much fewer cases overall I hope you can tell that there is something else odd about the vaccinated line. Firstly, the cases start to accumulate at a similar rate to the unvaccinated and secondly there is a flattening in the middle, as if there’s a pause.
We can look at this better in this graph.
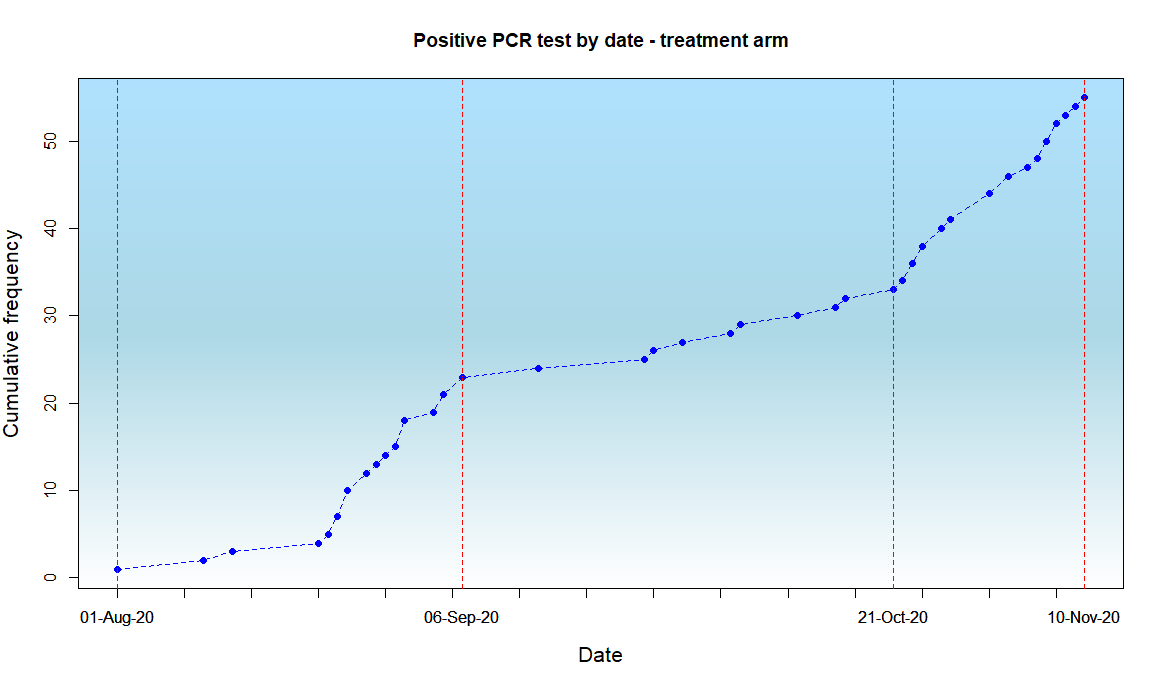
You should be able to see that up to the 6th September (about 5 weeks into the study when recruitment is increasing rapidly) there is a rapid rise in the number of cases in the vaccine arm and then this suddenly slows down until the 21st October when the rise rate goes back to normal. This only happens in the vaccinated group.
It’s as if someone switched the machine off, or turned it down somehow.
Now going back to our pizza analogy remember that the pizza delivery guy had to quickly adapt and print his ticket to match the amount of money that they knew the lady had picked up.
It’s the same here. In this chart the dotted line is the modelled12 (predicted) number of cases in the vaccine arm, assuming that the vaccine was 95% effective “after 4 weeks” as they said.
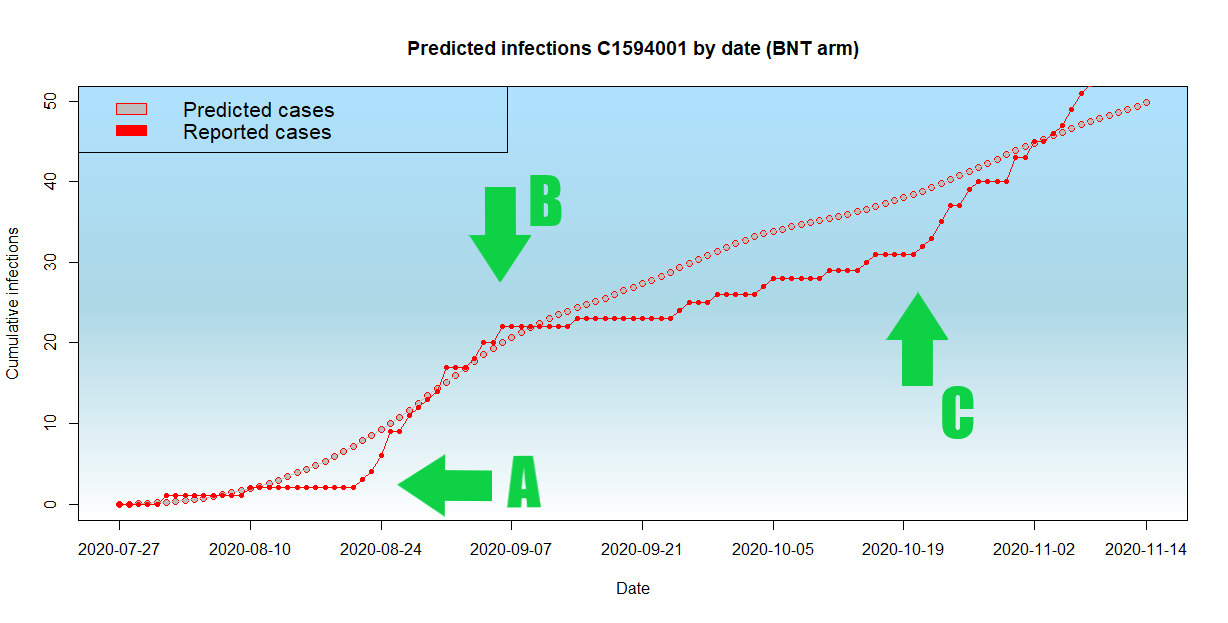
I have marked the inflection points on the curve and you might imagine the Pfizer people down at Pearl River doing something like this:
(A) “Oh shit Albert we haven’t had any cases at all people will think there is something up and we need some cases to be believable so we better start collecting them. Turn the machine up*”
(B) “Whoa Albert turn that machine down you’re going to catch up with those pesky placebos if you don’t watch out and we’ve got all the cases we need now to look convincing. Don’t get any more cases before the 20th October or we’re in the shit”
(C) “OK Albert you can turn the machine back up again now, the cases don’t count as long as they’re all recent recruits”
*By ”Up” of course I mean “Down” because the easiest way to impact whether you pick up any cases on a PCR test is just to adjust the Ct value (cycle threshold) for a positive test. If the Ct is very high (over 40) you will pick up a bunch of false positives and if it’s very low (say, less than 16) you will only pick up the real cases with a high viral load. Of course they wouldn’t know what the “sweet spot” would be which is why they would have had to change it as they went along.
And you might say “why didn’t they just record the tests as positive or negative in the case report forms?”.
Well that’s possible but some of the testing is automated so they can’t manually record false values for POSITIVE/NEGATIVE and if they did it might be very obvious on an audit.
What they could do was change the Ct threshold on the machine recording the tests so that they don’t record as positive. We don’t know whether that happened because the field that should have recorded it and should have been released in the Pfizer files (MBORRESU) is missing.
So convenient.
But one thing we DO know is that Pfizer knew which tests were coming in from which arm of the study (vaccinated or placebo) and that is because they had the blood tests from every person in the study at the Pearl River lab.
And all they had to do to identify which subject was vaccinated or not is test the blood.
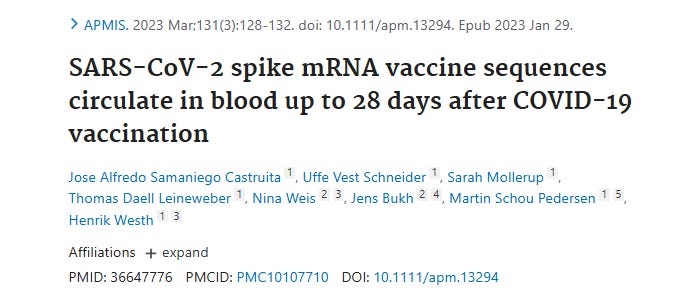
We know this to be true because Castruita showed in 2023 that even after 4 weeks there was enough circulating RNA (or DNA) from the COVID-19 vaccines to be able to perform genomic sequencing13.
In a highly controlled pharma randomised trial the databases holding information about which patient took which treatment (in this case vaccine vs placebo) are locked. Unlocking them would create audit flags and so the FDA would be able to see that there had been tampering. So it wasn’t possible to just cheat in the database.
But, because Pfizer already had the blood samples from every participant at the same lab that they insisted that the “cases” send their swab samples to, it was easy for them to record which sample was in which arm of the study.
The placebo tests could therefore just continue on the standard test machine and the vaccine arm group (having been identified from their own record of who was who, based on the blood tests) on another machine. And because they knew from the placebo arm how many patients so far had got COVID, they just needed to adjust the “vaccinated” machine up or down according to the number of positive tests they needed. A bit like the pizza guy.
But, you’re going to say, this is “conspiracy theory” and “there is no way to prove it” right14?
Well unfortunately for Pfizer they made a few mistakes and the big one was failing to fix the N-antibody (Nab) tests at the same time.
NABs Schmabs
When you “get COVID” naturally, what happens is that your immune system produces two sets of antibodies.
One is directed against the spike protein (S-antibody) and the other is directed against the nucleocapsid (N-antibody). The nucleocapsid is inside the virus particle so in order to be exposed to it you need to have the virus spill its contents. This will usually happen when your immune system kills the virus, so a natural immune response provides both sets of antibodies (anti-S and anti-N).

In contrast, following vaccination the spike gets flooded with antibodies and the immune system may not get the same exposure to the Nucleocapsid as in natural immunity, so the chance of showing N-antibodies (“NABs”) after a post-vaccine infection (which weren’t supposed to happen of course) is much lower.
How do we know? Well the manufacturers told us.
Here is the chart from Lindsey Baden’s paper from the Moderna trial where they looked at exactly this question.
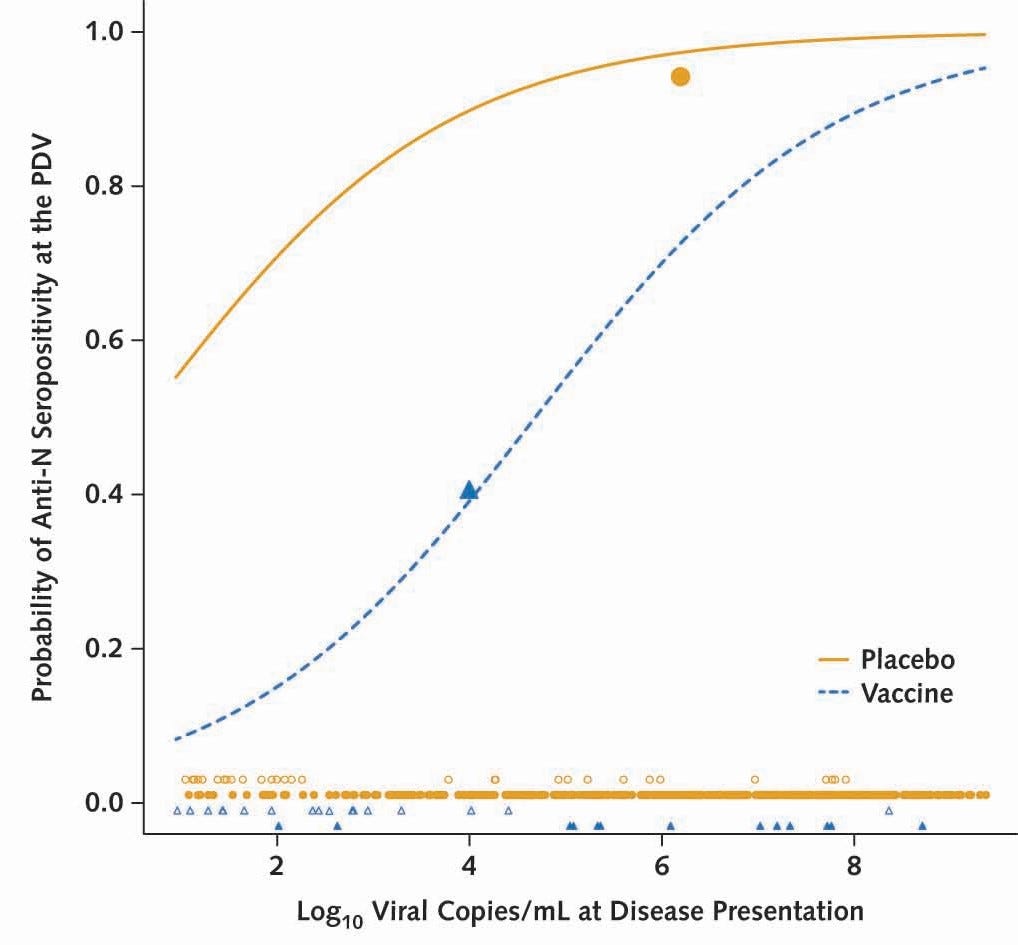
The chart shows the probability of a “Anti-N serology test” being positive during the Moderna vaccine trial and the bottom line is that at for most infections (other than the most severe, so about 95% of all recorded infections in the trial) the chance of testing positive on a Anti-N serology test was 2.3x lower (93% vs 40%) in the vaccinated group.
The same result was seen by Dhakal et al so this wasn’t just a ruse by Moderna to create some narrative that the COVID vaccines prevented severe disease (which was always the back up story and never shown in a randomised controlled trial). But the backup story by Baden shot Pfizer in the foot. So let’s look at what happened in the Pfizer trial.
Here are the N-antibody tests for each arm15
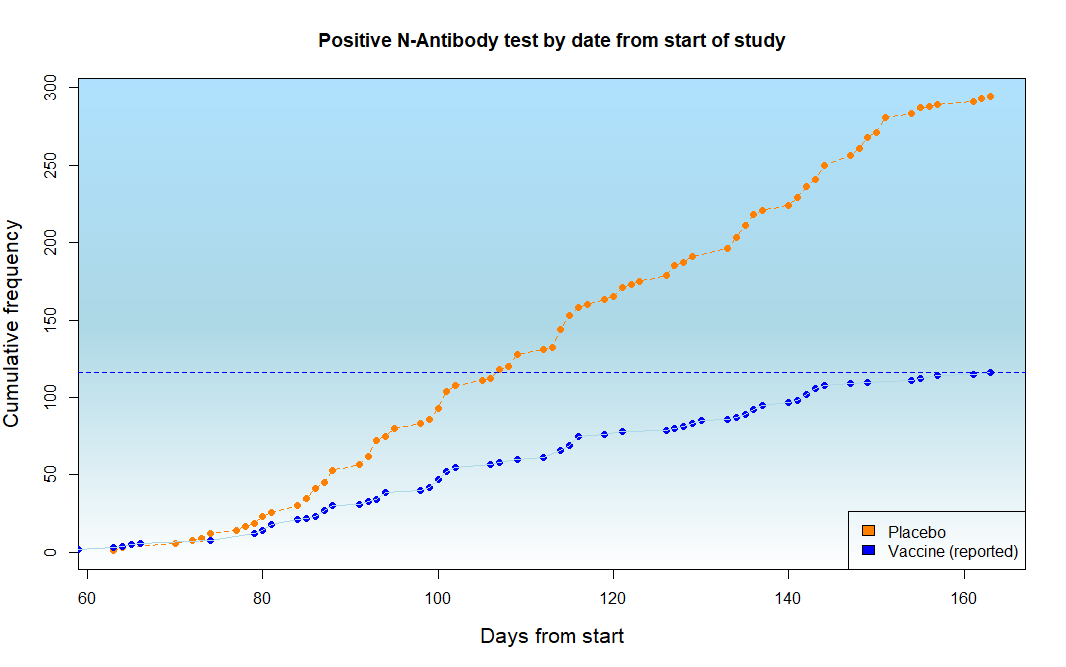
The blue dotted line is the total number of positive N-antibody tests in the vaccinated arm and is 11616 .
But wait, there were only 50 infected cases reported in the study by PCR.
That can’t be right surely?
You couldn’t have more than twice the number of cases of antibody-proven infection than PCR-documented infection in one group only - unless you were suppressing the PCR tests.
But it gets worse when you correct for the fact that, if you’re vaccinated, you have 2.3x less chance of showing N-antibody on a test.
So let’s correct the chart and show what the real infection rate was in the two groups.
Et voila…..
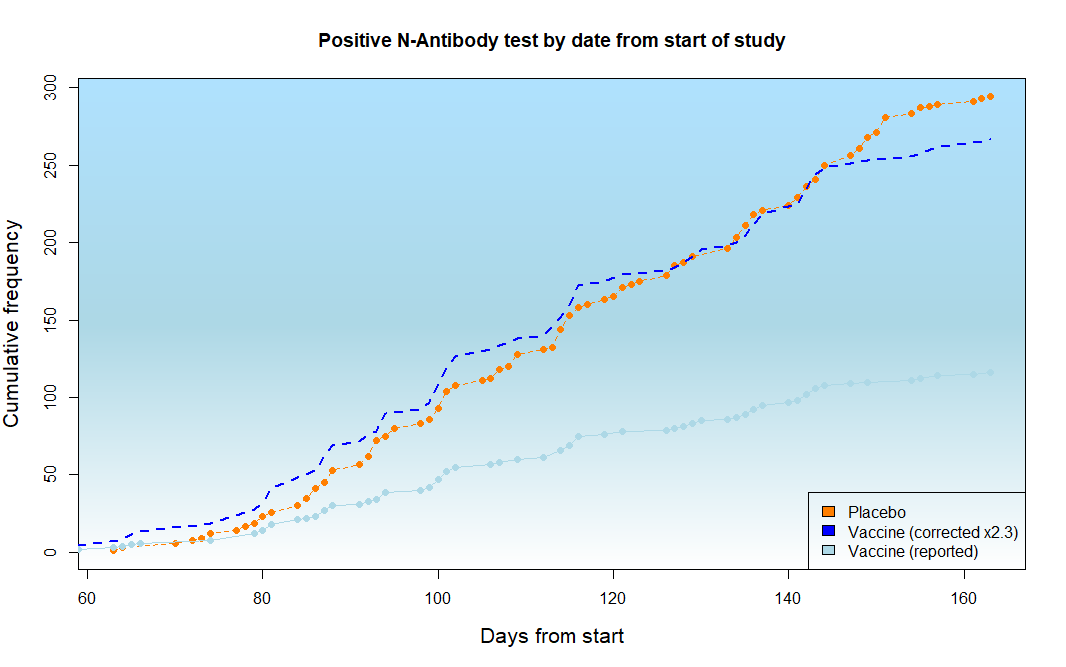
Well look at that. Pretty much identical curves17.
What that graph shows is that, even according to Pfizer’s own data, the antibody-documented infection rate in both arms was pretty much the same.
No “95% reduction in infection” at all.
It was only the recording of the PCR tests that was different.
So it was a scam.
But of course you’re not going to believe that it was a scam because the next thing you’re going to say is “well they said it reduced severity so it doesn’t matter”…
Well they didn’t say that. What they claimed was that the infection rate was less. But what Pfizer were actually saying was this:
In our large randomised controlled trial, the chance of a vaccinated person testing positive in our lab on our dedicated PCR machine was 95% less than an unvaccinated person testing positive.
It doesn’t sound such a good sell now does it?
But this isn’t the end of the matter, because I know you’re going jump up and down and demand that the Pfizer vaccine trial showed that there were less symptoms suggestive of COVID in the vaccinated.
So let’s go there.
Muh Symptoms
It was, in fact, the FDA that said (in their super intense thanksgiving-Turkey-sacrificing analysis that they spent at least 3 hours on)…
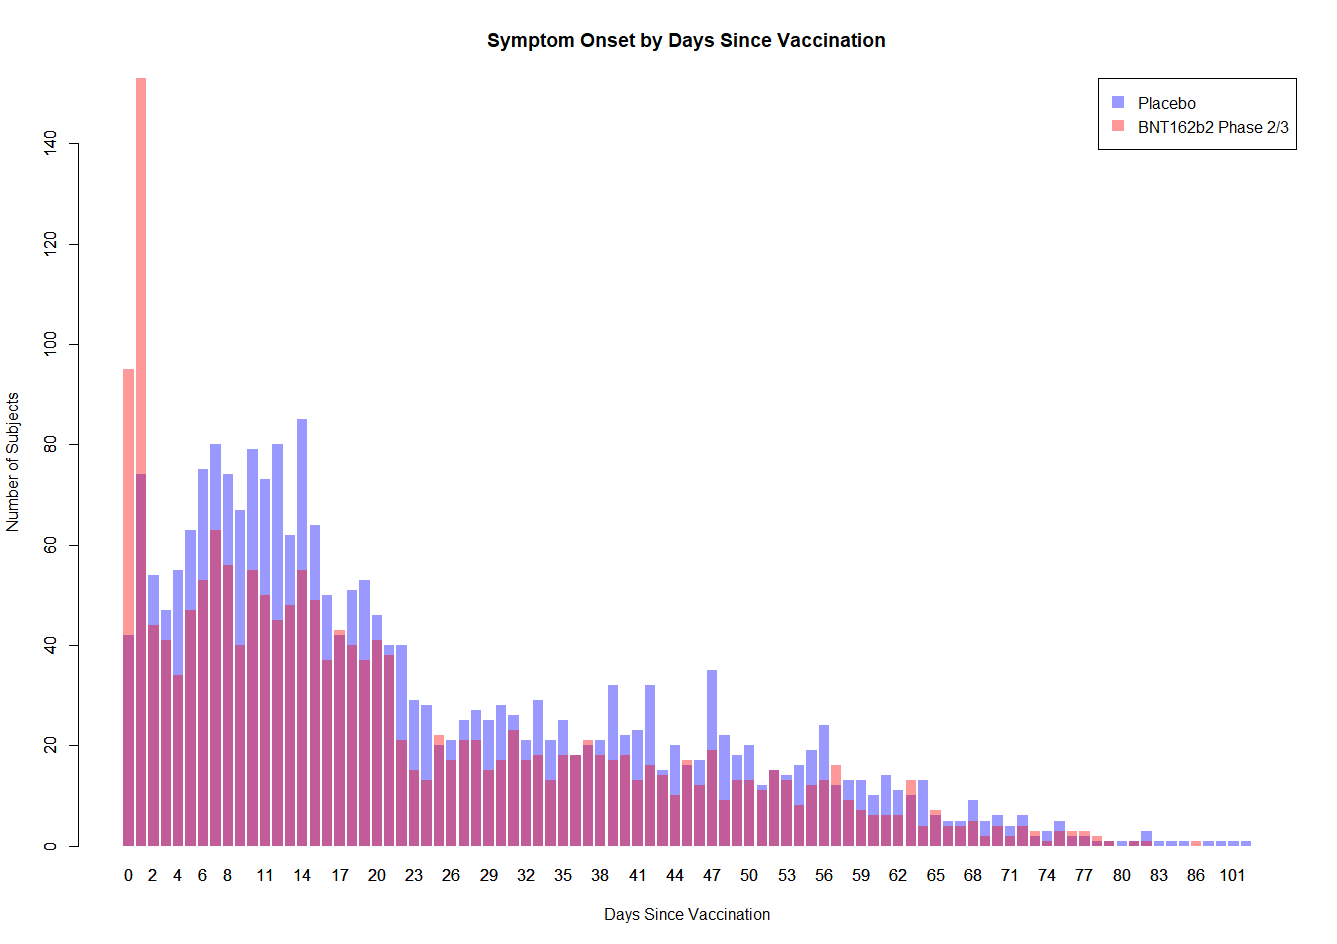
Among 3410 total cases of suspected but unconfirmed COVID-19 in the overall study population, 1594 occurred in the vaccine group vs. 1816 in the placebo group. Suspected COVID-19 cases that occurred within 7 days after any vaccination were 409 in the vaccine group vs. 287 in the placebo group. It is possible that the imbalance in suspected COVID-19 cases occurring in the 7 days postvaccination represents vaccine reactogenicity with symptoms that overlap with those of COVID-19.
“Suspected COVID” means that you felt like crap, had a fever, and probably had a cough or runny nose. Just like every other respiratory viral infection which you normally recover from in a week.
So in the first week after vaccination you were much more likely (42%) to feel like crap with symptoms that felt like COVID, but over the rest of the time you were slightly more likely to think you had COVID (13%) if you didn’t have the vaccine.
What a trade off.
And if you want to compare these “symptoms” you can see clearly from this graph that the first week is worse for the vaccinated and then over time the placebo group sort of do worse - but it’s probably not enough to make up for the first week’s disaster.
So, what exactly was this miracle vaccine preventing?
Well the worst thing about COVID, apart from the very small number of people who get post-viral pneumonia, is the fever - which makes you feel like crap and stops you going to work.
So presumably, if the MiracleVax™ was preventing this nasty viral infection by 95% then we should be able to see this reflected in the fevers. As in, if you take away all the statistical nuances and PCR tests and bla bla bla there MUST be a benefit for Pfizer’s victims customers of preventing the fevers that stop you going to work. Because otherwise, given there were no differences in overall deaths (actually the vaccinated group did marginally worse on that score too), then there has to be something that it actually worked for, given the dramatic 95% reduction in infection.
Right?
Who got the Fever?
Well, now we get into the nitty gritty of whether there was any way at all that the Pfizer trial “success” was real.. the fevers (and their sister symptoms chills, which if you’ve ever had a bad fever you will know is not something to be sniffed at).
You see, what the FDA failed to spot, whilst lauding the minor reduction in allocated “symptoms” from the vaccine, was the fever elephant in the room.
These are the numbers directly from the FDA’s review.
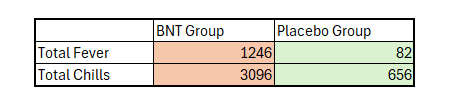
That is, there were over 1100 more fevers and over 2000 more reports of chills.
But you were stoked about the apparent 222 fewer people with “symptoms” in the vaccinated group, right?
It’s worth noting at this point that this was followed into the real world with reports of healthcare workers having to take time of sick from work - with vaccine related fevers - 29% reported in the report from Lidström from the Pfizer vaccine alone, and with up to 48% of health care workers taking time off work from all symptoms following vaccination.
So, let’s get this right.
Not only did the vaccine not prevent transmission - but you needed to take it to stop yourself getting sick enough that you couldn’t work, by getting sick enough that you couldn’t work. The memes sort of write themselves don’t they?
So what happens when we look at overall numbers of “fever or chills” in the whole trial irrespective of cause?
Because if our MiracleVax™ really did work, then the NEJM were right and overall there would be a bunch less fevers or chills in the vaccinated group.
Well here you go. Here’s the definitive analysis (that the FDA never did) looking at whether fever and chills - the major symptoms of “COVID” - were less in the placebo (blue) or vaccinated (red) arm.
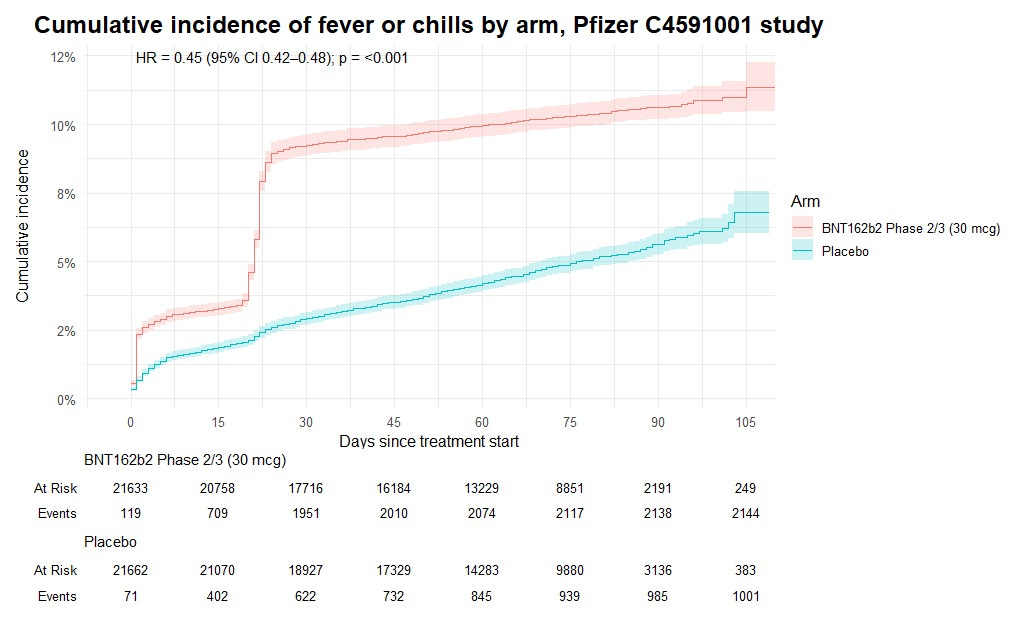
Remember that this includes fevers and chills from all causes, including “COVID” and showed that the chance of getting fevers or chills if you were vaccinated was over double that of the unvaccinated.
It’s a slam dunk wouldn’t you say?
All that money spent, all the hand waving about how the COVID vaccine was “95% effective at preventing COVID (whilst not actually showing a mortality benefit)”, all the cheating at trial centres, all the suppression of dissent from people who actually knew what they were talking about…
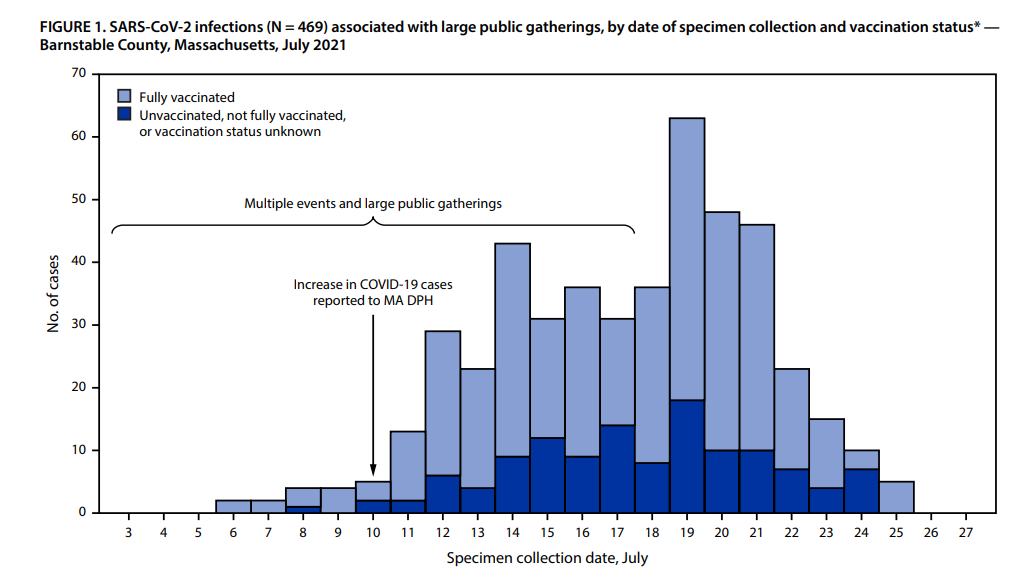
All for a fraud that the CDC knew was a fraud the first time that not a single case was prevented in the largest public gathering after the vaccine rollout in Barnstable, Masschusetts in July 2021 - where a large COVID outbreak occurred in a fully vaccinated population18.
And not a single “expert” on any of the panels - who were desperate to cross Pfizer’s palm with the public’s silver so they could get their subsequent awards and promotions - spotted the massive and obvious scam, or realised how they did it.
Well, now you know.

Remember that it can be shown that building in a delay (by saying that you’re not vaccinated until 35 days after the vaccine was given) provides a fake vaccine efficacy.
The cover story explanation for this is that there was a special “unblinding team” but no details of who was on that team, or what was to stop that team communicating with the study centres or Pfizer themselves, was provided.
Susan K Wollersheim is a pediatrician but only has one first author paper on Pubmed - but it’s a case report as opposed to a clinical trial or clinical research study. Her second mention on Pubmed is as second author in a genome sequence of a cocksackie isolate. Both appear to be at David Geffen medical school where she underwent her fellowship training. She never published again under that name.
Blue light filter glasses do absolutely nothing so it is apt that the lead “researcher” for the FDA is gullible enough to have bought a pair
If you didn’t already know, Penn & Teller are part of the skeptics society who are closely linked to Jeffrey Epstein, James Randi (aided and abetted identity fraud) and legal advocates for pedophiles. They really hate vaccine skeptics.
Reproduced plot in R from the original “positivity” data provided in the Pfizer data dump
The modelling required for this one graph was unbelievably time consuming.
Two analyses of this were made and in the first, a formula for a polynomial fit to the infection rates for the five countries involved was made using a base infection rate of 0.00018835
IR<-0.00018835*((0.3525*c(1:111)^3-30.911*c(1:111)^2+59.33*c(1:111)+111226)/111255)
In the second, which was a slightly closer fit to the “real” data, the infection rate was calculated by country for the number of patients in each country on each date based on “ourworldindata” infection rate data for that country, and smoothed using loess in R.
There was no appreciable difference to the findings when using either data set.
In fact there were a bunch of ways of testing the blood of participants to see who was vaccinated or not. An alternative way would be to test for antibodies but those don’t show up until about two weeks after injection.
We have also discussed how the genetic vaccines were set up to provide a specific “tag” which can be seen using CRISPR technology (SHERLOCK or DETECTR).

You can perform statistical tests to show that the accumulation of cases in the period 6th Sept - 21st October was anomalous by comparing the number of cases in this time between the groups (chisquare test 10/54 vs 122/272, p<0.001) or comparing the cases that arose in this time period to the model (Fisher test 9/55 vs 23/61, p=0.013) . The numbers vary slightly depending on the model or the Pfizer file used.
All files for these analyses were taken from the Pfizer file FOI repository at https://phmpt.org/pfizer-16-plus-documents/ e.g.
FDA-CBER-2021-5683-0123168 to -0126026_125742_S1_M5_c4591001-A-D-adva.xpt
FDA-CBER-2021-5683-0282366 to -0285643_125742_S1_M5_c4591001-S-D-mb.xpt
The placebo arm total number of cases in this chart is 294, close to the documented number of documented cases (275).
These curves are similar enough to be the same within the limits of testing available. There are few more positive tests in the vaccinated group early on and a few less positive tests later on.
In the Barnstable Massachusetts study (July 2021) the infected population were 74% fully vaccinated for a baseline population of 69% fully vaccinated, giving a derived vaccine efficacy of NEGATIVE 28%. That is, in this well matched group, you were 28% MORE likely to get COVID if you were vaccinated than unvaccinated, proving that the Pfizer claim of “100% efficacy against infection” in a study at a similar time was garbage.
Really interesting
I have done similar graphs but can't work put how to share. If you track the two arms by the datum how long they had been in the study that looks pretty suspect . Also all the date of tests gives an insight as apparently they weren't running test on weekends (weirdly) and most of the silummer there was little virus about
Pfizer worked it backwards and knew how many cases were needed to claim 95% and aimed for that (I recall there was a note in the design to that effect). Interestingly that same dubious graph was used in the AZ propaganda and they took the same methodology. Coincidence I am sure. 2 tictacs taken 14 days apart with an exclusion definition will also work well.
Basically the whole design is a nonsense as Doshi called it out in 2020 in his BMA article.
But protocol 8.1.3 (I think it is) noted they wouldn't even bother testing if symptoms were overlapping with vaccine reactogenicity. Thereby favouring the BNT arm for not testing. They also excluded more BNT participants for unclear protocol breaches than the placebo arm (to an extent that invalidates and claimed efficacy)
They then hurriedly burnt the data by jabbing the placebo arm. To ruin the control group. The hallmark of an orchestrated sham.
Oh and it didn't work in the real world either. And the knew it as intramuscular vaccines don't induce a mucosal response . They knew it and gamed the world.
This alleges fraud with strong circumstantial evidence. It deserves a Special Counsel Investigation.